Crude Oil and U.S. Dollar Index Technical Analysis
Currencies / US Dollar Dec 28, 2014 - 11:41 AM GMTBy: Austin_Galt
 Oil
Oil
Oil has continued to crash throughout December but I suspect there is now only marginally lower to go with the final low imminent.
Let’s investigate using the monthly and daily charts.
OIL MONTHLY CHART
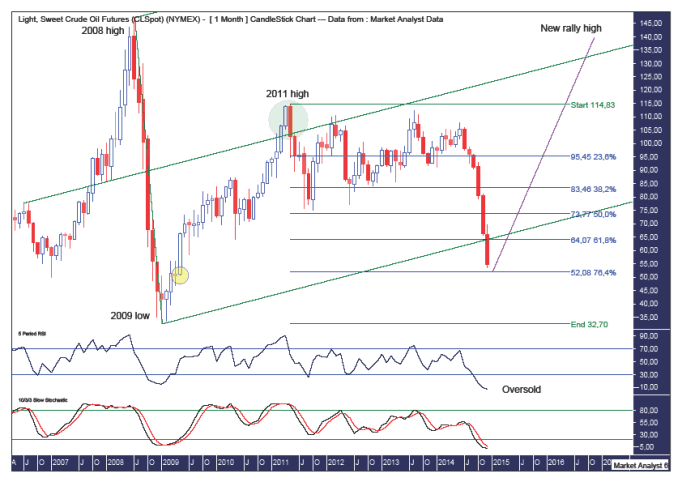
I have added an Andrew’s Pitchfork which shows price cracking below the lower pitchfork channel. On first look this appears bearish but I suspect this is a false break playing out.
In the green highlighted circle we can see price made a false break above the middle trend line to form the 2011 high before turning back down into the lower channel. I think the same type of trading is now occurring with price about to put in a major low below the lower trend line before it reverses back up into the lower channel.
The Relative Strength Indicator (RSI) is extremely oversold with a current reading of 7.14. My chart goes back to 1983 and this is the lowest reading this indicator has ever recorded in all that time! Surely something has to give!!
The Stochastic indicator is also very oversold and looks like it may be starting to turn back up.
I have added Fibonacci retracement levels of the move up from the 2009 low to 2011 high. Price now looks to have the 76.4% level at US$52.08 in its sights and this is where I’m targeting the final low to occur.
I actually suspect price may tickle the underside of this level. Why?
Upon closer inspection of the chart I noticed where price exploded higher in a little parabolic-like move. This took place in May 2009 and I have drawn a yellow highlighted circle to denote this area. Price often returns to these exact levels when correcting in the future. I suspect price may dip just under the May 2009 low which stands at US$50.43. We may even see price printing a number beginning with US$49.
So, essentially I am now looking for a low to form around the US$50-$52 level while I remain steadfast in my belief that price will not be testing the 2009 low which stands at US$32.70.
As mentioned previously, I will put out some daily chart analysis for subscribers when I like the pattern for low but let’s have a quick look at how things currently look.
OIL DAILY CHART
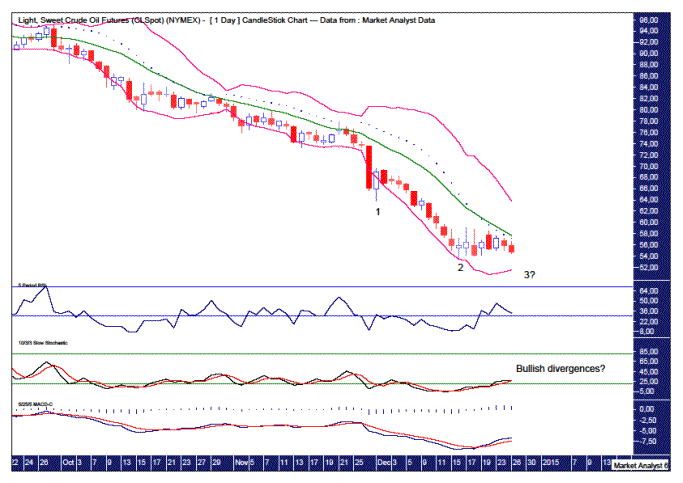
The Parabolic Stop and Reverse (PSAR) indicator shows the dots holding price as it recently embarked on a small rally. Price wasn’t strong enough to take out that resistance and has subsequently turned back down in weak fashion.
The Bollinger Bands show price moving away from the lower band but the middle band seems to have stopped its advance. A move back to the lower band now looks on the cards.
A “three strikes and you’re out” low formation looks to be setting up and all that is required now is the third consecutive lower low.
This coming low looks set to be accompanied by bullish divergences in the lower indicators being the RSI, Stochastic and Moving Average Convergence Divergence (MACD) indicators.
Personally, I am looking for the coming low to be the final pullback low before price charges higher on its way back above US$100. I am expecting price to come back down in 2015 but only expect a higher low. Time will tell.
As for what the fundamental reason might be, is it out of the question that the Saudi sheiks eventually cut back production in order to line their pockets even more??
US Dollar Index
The US Dollar has recently broken some key resistance levels which leads me to believe an even bigger rally is set to take place. However, I still expect a move back down in the short term before this rally really kicks into gear.
Let’s investigate by looking at the bigger picture first.
US DOLLAR MONTHLY CHART
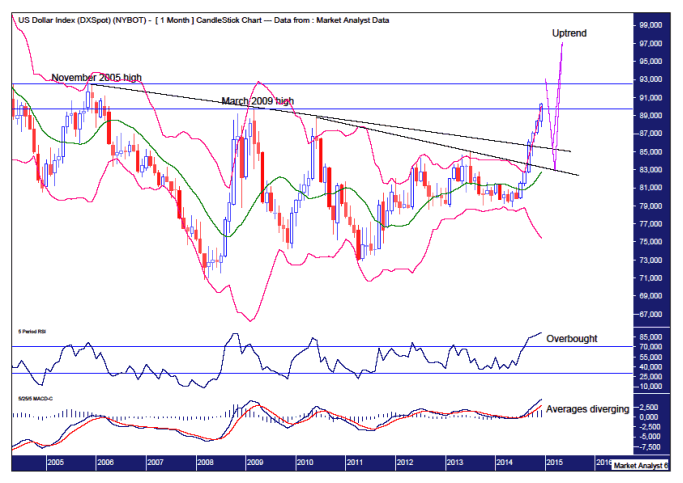
The US Dollar index has broken above a key resistance level being the March 2009 high at 89.71 which was the previous major swing high. There is still no sign of reversal so it is quite possible for price to go even higher before reversing. Price may even take out the November 2005 swing high at 92.53 before the correction commences. This level is denoted by the higher horizontal line. Personally, I favour that happening. Let’s see.
The Bollinger Bands show price clinging to the upper band which is normal for a big uptrend. I expect a short term high shortly and once in place I will be looking for price to come back to the middle Bollinger Band before resuming back upwards.
I have drawn two downtrend lines and I expect the eventual correction to find support at one of these trend lines. Personally, I am leaning to the top trend line, which connects the November 2005 and March 2009 highs, to hold any pullback.
The Relative Strength Indicator (RSI) is overbought so a move down shortly surely has to be on the cards. Then after price turns back up perhaps any new rally highs will be accompanied by bearish divergences.
The Moving Average Convergence Divergence (MACD) indicator is trending up and looking bullish although the averages appear to be diverging quite a bit so perhaps a correction will return them to normalcy. I suspect a pullback will see these averages come together for a “kiss” before price turns back up and these averages continue trending up.
So how high can we expect this rally to eventually trade? Let’s move on to the yearly chart to find out.
US DOLLAR YEARLY CHART
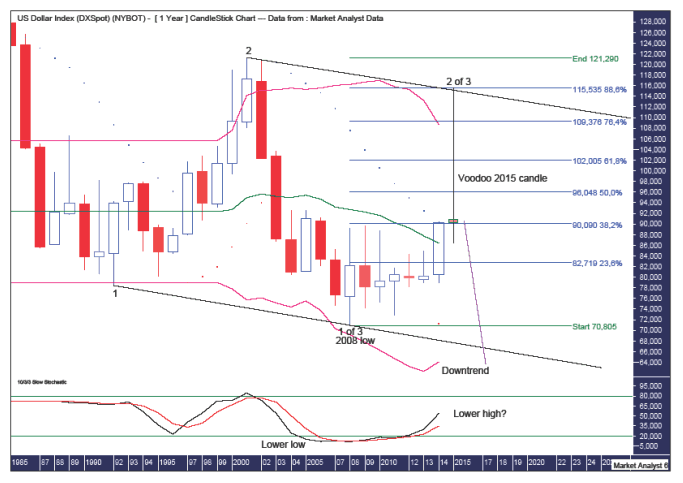
This current rally has broken another key resistance level which stemmed from the yearly Parabolic Stop and Reverse (PSAR) indicator. This pertains to the dots on the chart so with the dots now on the downside there is a bullish bias in effect here. Now caution needs to be applied here as this indicator is more effective when used with the trend and price is clearly trading against the main bear trend.
This big bear trend consisting of lower lows and lower highs can be seen in more detail by the Elliott Wave annotations I’ve added to the chart. I am viewing the wave 1 low and wave 2 high as already being in place. That implies we are currently in wave 3 which is often the most impulsive of all waves.
I am viewing the 2008 low of 70.80 as the end of minor wave 1 of major wave 3 while this current rally is minor wave 2 of major wave 3. Once this rally high is in place then minor wave 3 of major wave 3 should see the value of the US Dollar get absolutely annihilated. That’s how I see it playing out anyway!
The Stochastic indicator is showing a potential bearish pattern of lower lows and lower highs assuming the next high will indeed be lower which looks likely.
So how high will this rally trade?
I have drawn two parallel black down-trending lines which form a downtrend channel. I am looking for the rally high to spike up to the top of this channel or thereabouts. The top of the channel is currently around 115.
I have also added Fibonacci retracement levels of the move down from the wave 2 high to 2008 low. The two levels I am focusing on are the 76.4% level at 109.37 and the 88.6% level at 115.53. I now expect the rally high to be around one of these levels.
I have added Bollinger Bands which show price currently just above the middle band. Any correction now may see price come back and find support at this middle band which is currently just above 86. That would also fit in with price finding support at the top trend line as discussed in the monthly analysis.
I then expect price to rally up to the upper band. As often happens with tops, price may trade above the upper band just as it did at the wave 2 high. Interestingly, this upper band is currently right around the 76.4% Fibonacci retracement level. So a rally high around the 88.6% level would fit in with the top being higher than the upper band.
I have drawn Voodoo style how I currently expect the 2015 candle to look. It calls for a spike higher before immediately reversing back down and closing the year marginally lower. A volatile rollercoaster ride! If that occurs then I would expect the move down to continue with momentum in 2016 – just as one would expect from an impulsive wave 3 of 3 move.
We have to keep in mind that a massive bear market is in play and that any move up should not exhibit too much strength. That has certainly been the case since the 2008 low and this is one reason why I expect the coming rally high to be a spike high that reverses down immediately and not a multi-year move up that builds strength.
Let’s now look at the smaller picture with the weekly and daily charts.
US DOLLAR WEEKLY CHART
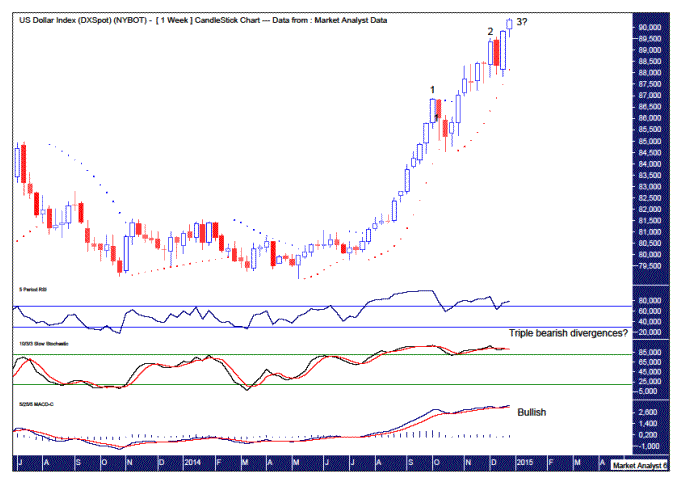
We can see price came down last week to PSAR support, denoted by the dots, which held the move down. Price then reversed back up to new rally highs in what looks like a little parabolic move. When the dots get this steep it usually means the end is nigh…for the current run anyway.
It looks like a “three strikes and you’re out” top formation is setting up which consists of three consecutive higher highs. This often leads to a significant decline.
The RSI and Stochastic indicator are showing multiple bearish divergences. This coming high looks set to be accompanied by triple bearish divergences in both these indicators which is generally a bearish sign.
The MACD indicator is still trending up however this indicator has had a bullish bias for quite some time now so perhaps it is due for a “rest”.
US DOLLAR DAILY CHART
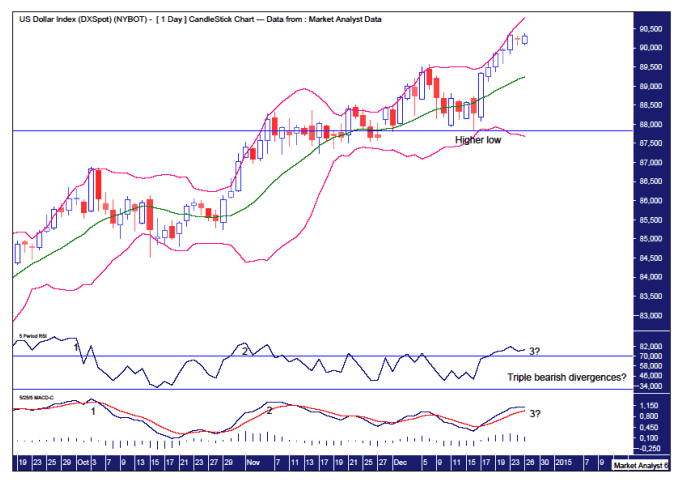
I have drawn a horizontal line to denote the recent low at 87.83 which was a higher low and keeps the uptrend intact.
This low was right around support from the lower Bollinger Band and price has since surged back to the upper band. There still looks to be some time and price left in this current move up. I suspect price can surge higher over the coming week or two before price corrects.
The RSI and MACD indicator both show the coming high looking likely to set up a triple bearish divergence. Things are certainly becoming stretched!
Summing up, price has already broken some key resistance levels which augers for higher prices. However, as often occurs after breaking known resistance levels, price then retreats as it builds up its strength for the next northerly assault.
By Austin Galt
Austin Galt is The Voodoo Analyst. I have studied charts for over 20 years and am currently a private trader. Several years ago I worked as a licensed advisor with a well known Australian stock broker. While there was an abundance of fundamental analysts, there seemed to be a dearth of technical analysts. My aim here is to provide my view of technical analysis that is both intriguing and misunderstood by many. I like to refer to it as the black magic of stock market analysis.
© 2014 Copyright The Voodoo Analyst - All Rights Reserved
Disclaimer: The above is a matter of opinion provided for general information purposes only and is not intended as investment advice. Information and analysis above are derived from sources and utilising methods believed to be reliable, but we cannot accept responsibility for any losses you may incur as a result of this analysis. Individuals should consult with their personal financial advisors.
© 2005-2022 http://www.MarketOracle.co.uk - The Market Oracle is a FREE Daily Financial Markets Analysis & Forecasting online publication.


