


Nationwide- UK House Prices Plunge by £5,000, 2.5% in May
Housing-Market / UK Housing May 29, 2008 - 04:14 PM GMTBy: Nationwide

 • House prices fell by 2.5% in May
• Prices are 4.4% lower than this time last year, but remain 5% higher than 2 years ago
• Falling house prices combined with higher inflation makes MPC decision more difficult still
• Borrowers are better placed to weather the storm than in the 1990s
• Tighter credit conditions should help the longer term sustainability of the market
| Headlines | May 2008 | April 2008 |
| Monthly index * Q1 '93 = 100 | 345.7 | 354.6 |
| Monthly change* | -2.5% | -0.9% |
| Annual change | -4.4% | 1.0% |
| Average price | £173,583 | £178,555 |
* seasonally adjusted
Commenting on the figures Fionnuala Earley, Nationwide's Chief Economist, said: "The pace of house price falls accelerated in May as more weak economic news added to the gathering momentum of negative sentiment about the housing market. House prices fell by 2.5% during the month, the largest recorded monthly fall in the history of the Nationwide monthly index [1] . At seven months, this is also the longest consecutive period of monthly falls since 1992. Prices have fallen 4.4% since this time last year, the biggest annual fall in house prices since December 1992 when prices were falling at an annual rate of 6.3%. The price of a typical house is now £173,583, £8,000 less than this time last year. However, the strength of house price growth up until last year means that prices are still 5% higher than two years ago and 10% higher than three years ago."
Persistent inflationary pressures threaten cuts in interest rates
“Problems in credit markets have clearly been the trigger for changing fortunes in the housing market and while it is never wise to place too much weight on one data point, the apparent speed of the adjustment may lead the MPC to look more closely at the balance of risks to inflation in the medium term. Stronger than expected inflation appears to have shattered hopes of an early cut in the Bank Rate in June, but more downbeat economic and housing market data could lead more MPC members to join David Blanchflower in voting for pre-emptive cuts. The decision will be very difficult with new highs in oil prices, but as higher prices of essential items squeeze consumer spending power and housing market weakness weighs down on confidence, the balance of risks to inflation in the medium term could shift enough to lead the MPC to cut rates sooner than the markets currently expect.
“The housing market has not been immune from weaker economic sentiment. Three important data series reported record lows in April. The Bank of England reported a 11% monthly drop in house purchase approvals in March to reach a seasonally adjusted 64,000 - the lowest since records began in 1993. RICS estate agents reported the most widespread regional falls in house prices in the history of their series. However, we estimate the size of the average fall for the UK implied by the RICS data was around 2% over the last three months - consistent with figures from Nationwide. House price expectations also fell into negative territory, as the Nationwide Consumer Confidence Index for April reported that consumers expect prices to fall by 1.7% over the next six months.
Falling prices erode large gains of recent years
“A further fall in house prices in May was not unexpected, and for most of those not wishing to move house or borrow money secured on it, the fall in value of their home is likely to be of limited concern in the short term.While the value of our homes is important as security, the most recent falls in prices for most borrowers will have simply eroded some of the large gains that were made over the last few years. While prices have fallen by 4.4% since May 2007, they still remain 5% higher than in May 2006 and 10% higher than in May 2005.
…and most borrowers are better placed to weather the storm.
 “Current market conditions inevitably lead to comparisons with the last episode of falling prices. However there are a number of reasons to believe that today’s borrowers are better placed to weather the storm than in the 1990s.
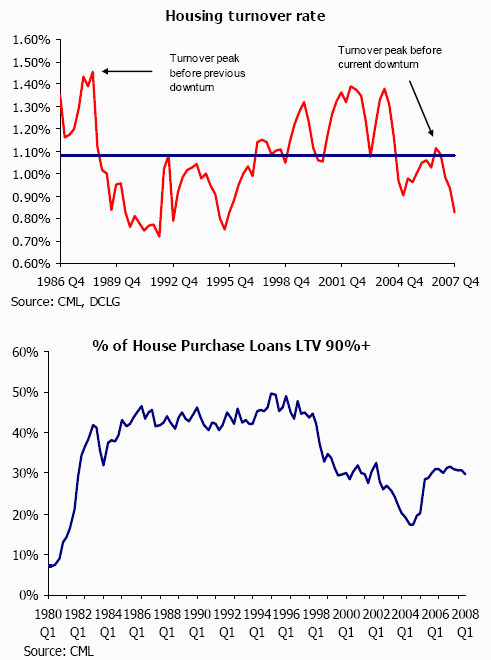
“First, fewer homeowners bought at the top of the market in this cycle. A comparison of turnover rates2, which take into account growth in the markets over time, shows that a far higher proportion of homeowners bought at the very top of the market in the 1980s. In contrast the turnover rate at the peak of this cycle was only marginally above the long term average. This means a much smaller proportion of borrowers face the full effect of falls in prices than was the case in the 1990s.
“Secondly, today’s borrowers have typically put down a larger deposit than their 1980s counterparts. While credit conditions have loosened in the UK housing market over the last few years, lending has typically remained at lower loan-to-value ratios than was the case in the 1980s. Of loans made for house purchase (which typically have higher loan-to-value ratios than remortgages) in 1988-89 - the last two years of rising prices in the last cycle - 44% of house purchase loans were more than 90% of the value of the property. In comparison in 2006-07 - the last two years of rising prices in this cycle - only 31% of these loans were at such high loan-to-value ratios.
“Thirdly, a much greater proportion of today’s borrowers have opted to repay capital rather than just interest. In 1988-89 about 85% of loans were on an interest-only basis, reflecting the popularity of endowment loans at that time. In comparison in 2006-07 only 30% took out interest-only loans and the majority of borrowers will therefore have repaid some capital and improved their underlying equity position. The proportion is even lower for first time buyers too, with only 26% of those taking loans in 2006-07 choosing an interest-only mortgage.
Tighter credit conditions now should lead to a more sustainable market
“Tighter credit conditions in the market at present are making it more difficult for borrowers to obtain loans at higher loan-to-value ratios. While this is frustrating for those in that position, more stringent underwriting criteria should ultimately lead to fewer overstretched borrowers and hence a more stable and sustainable market.”
| Fionnuala Earley Chief Economist Tel: 01793 656370 fionnuala.earley@nationwide.co.uk |
Katie Harper Media Relations Manager Tel: 01793 656215 katie.harper@nationwide.co.uk |
Notes: Indices and average prices are produced using Nationwide's updated mix adjusted House Price Methodology which was introduced with effect from the first quarter of 1995. Price indices are seasonally adjusted using the US Bureau of the Census X12 method. Currently the calculations are based on a monthly data series starting from January 1991. Figures are recalculated each month which may result in revisions to historical data. The Nationwide Monthly House Price Index is prepared from information which we believe is collated with care, but no representation is made as to its accuracy or completeness. We reserve the right to vary our methodology and to edit or discontinue the whole or any part of the Index at any time, for regulatory or other reasons. Persons seeking to place reliance on the Index for their own or third party commercial purposes do so entirely at their own risk. All changes are nominal and do not allow for inflation. More information on the house price index methodology along with time series data and archives of housing research can be found at www.nationwide.co.uk/hpi
Nationwide Archive |
© 2005-2022 http://www.MarketOracle.co.uk - The Market Oracle is a FREE Daily Financial Markets Analysis & Forecasting online publication.