


Stock Market At Minor Top
Stock-Markets / Stock Markets 2014 Dec 22, 2014 - 06:00 AM GMTBy: Andre_Gratian

 Current Position of the Market
SPX: Long-term trend - Bull Market
Intermediate trend - More time is needed to clarify the market position.
Analysis of the short-term trend is done on a daily basis with the help of hourly charts. It is an important adjunct to the analysis of daily and weekly charts which discusses the course of longer market trends.
AT MINOR TOP
Market Overview
My "market bounce" prediction made in the last newsletter was a slight understatement. For the week, SPX rose 105 points from Monday's 1973 low, almost duplicating its former high by the end of the week. Most indices also had strong "bounces" although they varied, with the performance of the SPX being the strongest. That could be the first occurrence which raises some questions about the nature of this rally, especially since the absolute worst performer was XIV, as we will see later. It will take another couple of weeks to sort out what the market is really doing. Is this a form of bear market rally, or the beginning of another huge move to the upside? We will probably have to wait until the first week in January to get a clearer picture. Let's look at the indicators.
Momentum: This rally caused the weekly MACD to turn up slightly, and kept it from making a bearish cross. The daily MACD also turned up, but not enough to make a bullish cross since its histogram remained negative.
The weekly SRSI turned back up, making a bullish cross, but ended with even more negative divergence than at its previous high. The Daily gave a buy signal, angling over slightly on Friday. At 80 it remains well below its potential 100 reading.
Breadth: Ending the week at 16.67, the McClellan Oscillator is now barely positive and has a long way to go to confirm this price explosion which just barely turned up the Summation Index.
Structure: Probably still in primary wave 3, but this could be wave B of 4. More data is required to clarify.
Accumulation/distribution. Short-term: We may have started a short-term distribution pattern. Long-term: The current bottom pattern is nearly exhausted.
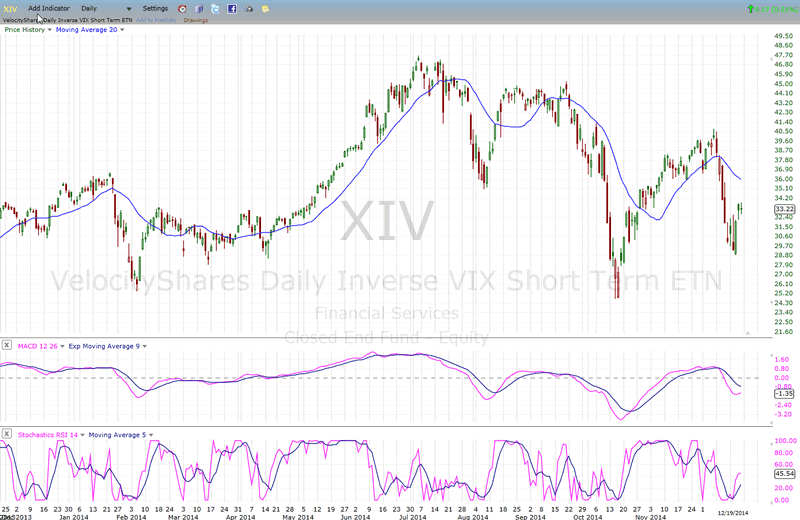
XIV: If there is one indicator which is screaming: "bear market rally!" this is it. It will have to do some fancy catching up to suggest otherwise.
Cycles: The short-term cycle low came on Monday. We could be in the middle of a battle between the 40-yr Kress cycle which has turned up, and the 7-year biblical cycle which is trying to turn down.
Chart Analysis
We start with the weekly SPX (chart courtesy of QCharts, including others below) with the McClellan Summation Index posted underneath it.
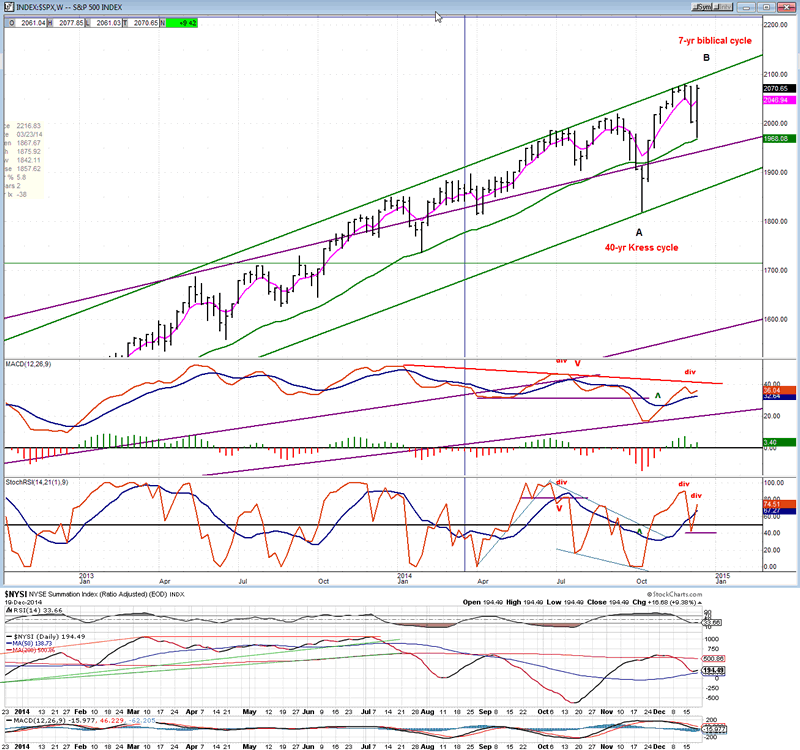
On the weekly chart, I have made some notations that are purely speculative at this point. With the assistance of technical analysis, the market affords us a short term glance into the future and the analysis is easily verified by the market action. This is not so easily done with long term analysis since verification may not come for several months and years. Fortunately, we will not have to wait that long to see if what I have posted on the chart is accurate or not. Only a few weeks will be needed to tell us if this is a valid premise, or if we should reject it.
Last week's move has all the markings of hyped-up short-covering rather than a move which has lasting implications, and it would make sense that all this grand-scale volatility will be the result of two major cycles in a vicious duel for control of the market. For the moment, at least, the indicators appear to support this notion. The SRSI and MACD have turned up, but their performance is weaker than the price move. Of course, this could change and they may look quite a bit different a couple of weeks from now. The Summation index, on the other hand, was hardly fazed by a 100+ point move on the SPX. What's wrong with that picture?
Again, it is best not to form definite opinions until we see what happens over the next couple of weeks. The SPX will tell us soon enough if it is able to pierce through the overhead resistance which exists at the top of the intermediate channel. Like the Fed, we can afford to be patient!
The daily chart shows us the reason why the decline stopped where it did: it was the bottom of a channel. It was also at a support point and just above the second gap from the previous low. What was not so predictable was the strength of the rebound.
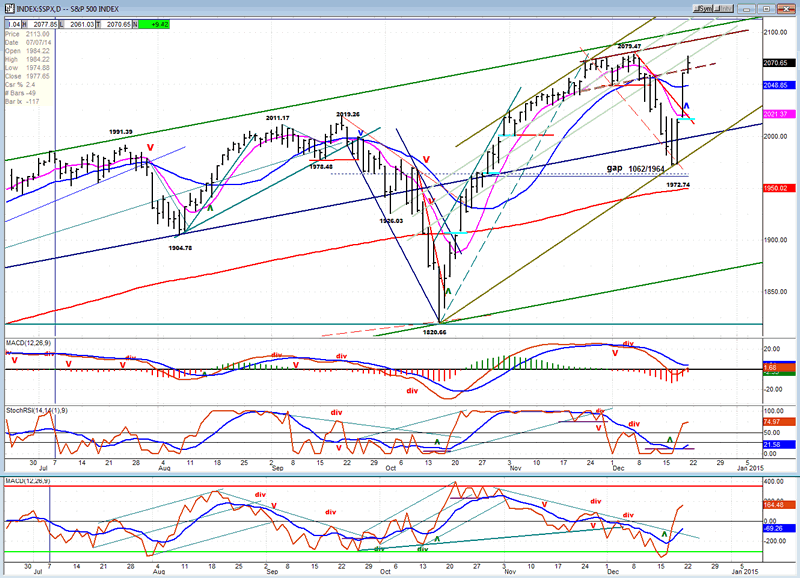
And how did the oscillators react to all this? Just OK so far. The MACD essentially found support on the zero line but it was not enough of a move to generate a bullish cross as the histogram did not turn up but remains negative.
The SRSI did go positive after making a bullish cross, but already apears to be losing its upside momentum by angling over on Friday. At 75, it could still go as high as 100, and must if it is to signal that we have started a strong uptrend. Turning lower as, or shortly after the index makes a new high will be bearish.
The same can be said of the A/D oscillator. It has stopped well short of its normal overbought level and it, too, has started to angle over. We'll have to watch its performance closely vis a vis the market over the next couple of weeks.
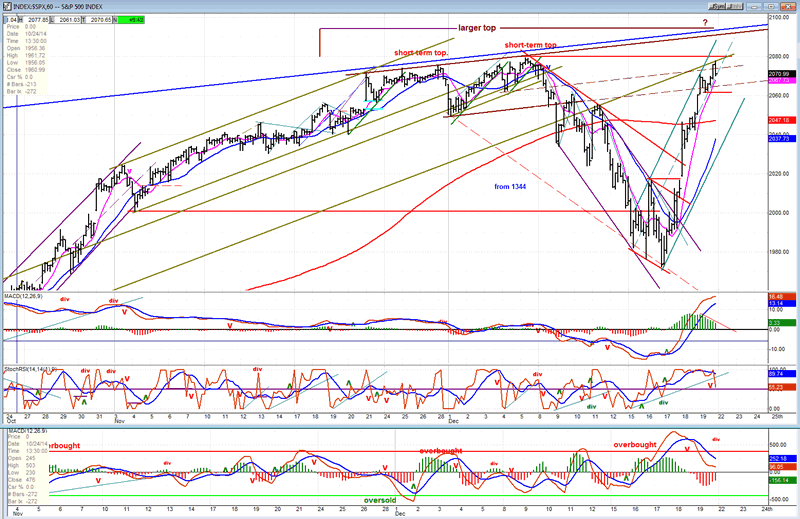
Finally, we come to the Hourly Chart, the short term crystall ball par excellence!
I have not given up on the idea that the SPX could be forming a larger top which will bring about an even larger decline. If so, it will first define itself on this chart through its price action and indicator readings.
From the 1973 low, SPX gapped over the former resistance level (red line) and was off to the races. The first consolidation could not even go sideways but continued to creep up and rushed higher when complete. The second consolidation was a little more sedate, with a slight downward bias. When, over, this could only give us a much diminished upside push to some resistance, turning down in the last hour. It would seem that a minor top has been reached which should produce the best corrrection yet of the move from 1973.
The oscillators seem to agree. The high of the rally was made while the A/D oscillator had already started to correct from an overbought level. On Friday, it was joined by the SRSI, while the histogram, although still positive, had already started to retrace the day before.
It does appear that we have made a minor top but, as the qualifier implies, it is not expected to be the last one, nor to be the one that wil decisively unveil the market's intention. For that, we will need to wait for the next higher high and especially for what happens afterwards!
Sentiment Indicators
The SentimenTrader appears to have stopped publishing its weekly chart of the sentiment gauge.
XIV (Inverse NYSE Volatility Index) - Leads and confirms market reversals.
Of all the leading indexes which have diverged from the SPX's performance this past week, the most perplexing one is the XIV. Its relative performance is a gigantic non-confirmation of the rally. Should this be taken at face value? Only time will tell, but this creates uncertainty about the future market trend, and it's best to keep it in mind.
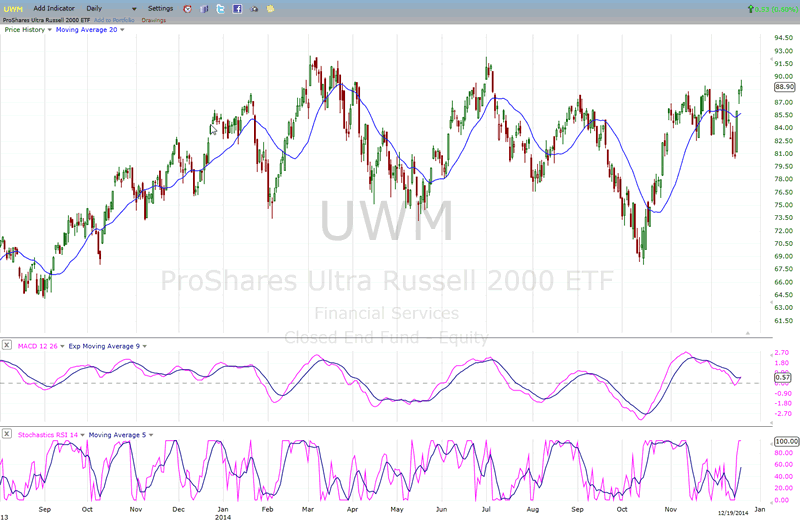
IWM (iShares Russell 2000) - Historically a market leader.
IWM threw us a bit of a curve with the fake break below its former support. However, it has yet to make a new all-time high, so let's wait for more clarity here also
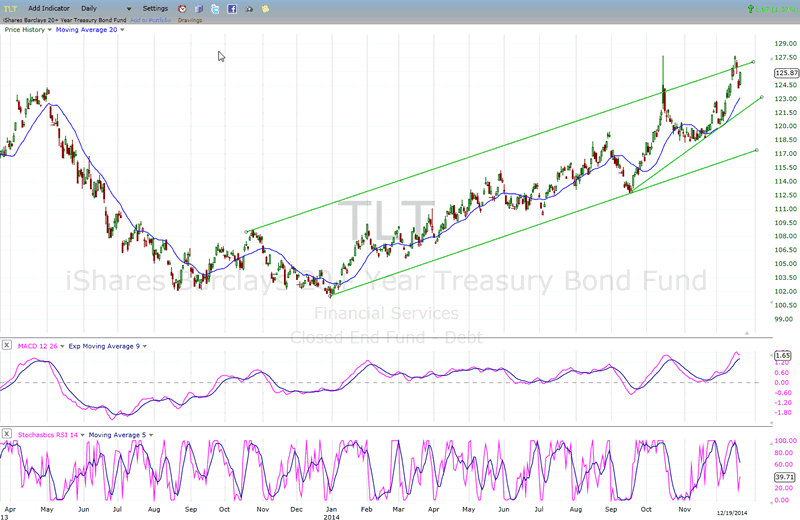
TLT (20+yr Treasury Bond Fund) - Normally runs contrary to the equities market.
TLT is finding resistance at the top of its channel. It may try again to go through and trade in a steeper channel, but the odds probably favor more consolidation. Let's give it a little time.
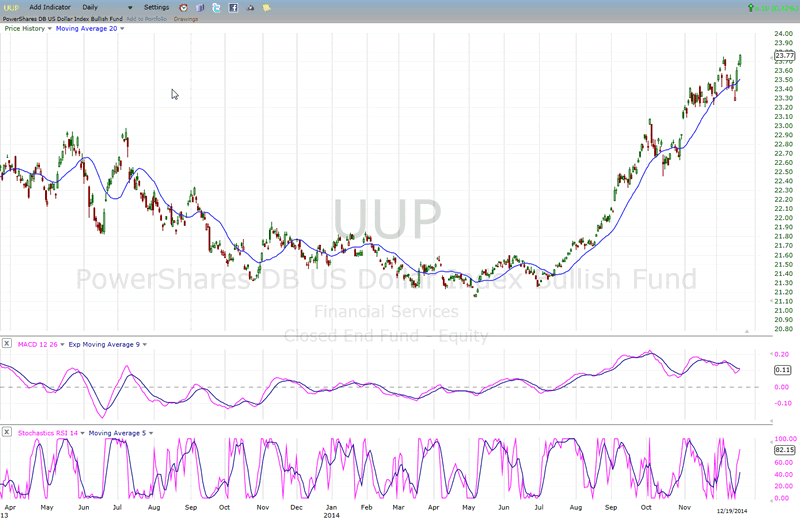
UUP (dollar ETF)
UUP has continued to advance, but with its MACD decelerating, it is likely that it will soon pause to correct.
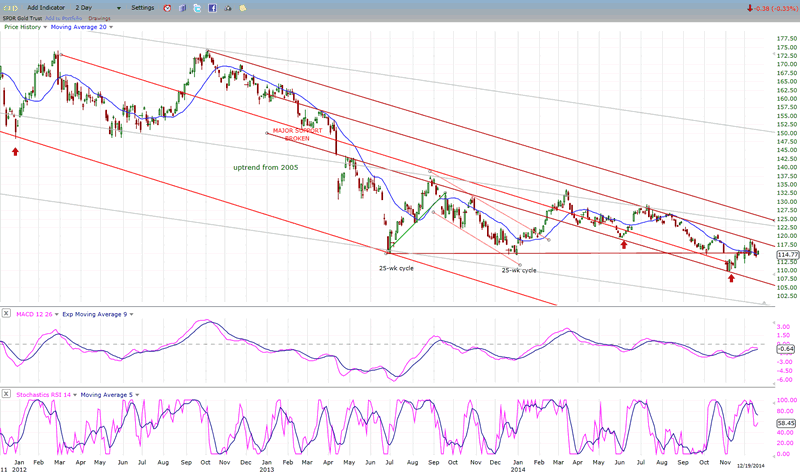
GLD (ETF for gold) - Runs contrary to the dollar index.
GLD's advance continues to be impaired by the dollar's refusal to correct. As implied above, this may only be a short-term restriction. When it starts up again, we will find out if GLD has enough strength to move through its upper intermediate channel line.
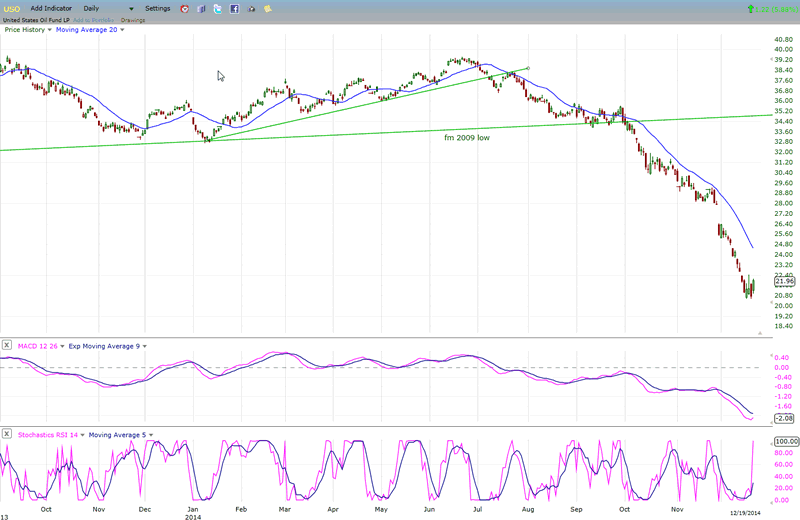
USO (US Oil Fund)
Last week, I sugested that crude would find temporary support around $55. It has and has had a minor rally. I don't know how long it will remain at this level but, eventually, it will continue lower to at least $40. USO is reflecting crude's action with a pause of its own. It is fair to assume that when oil continues its decline, so will USO.
Please keep in mind that, longer term, USO has the potential to reach 13, and even 8.
Summary
If we were in a confirmed bear market, it would be easy to characterize last week's rally as a "bear market rally" since this is what it looks like. Of course, if we are making a B wave this characterization is correct. At the moment it is only a possibility and we will have to wait a little longer to become more confident about the market's current intermediate term position.
What we can say with a little more assurance is that there are many warnings about being at a short-term top, most likely followed by a new high after a small correction has been completed.
FREE TRIAL SUBSCRIPTON
If precision in market timing for all time framesis something that you find important, you should
Consider taking a trial subscription to my service. It is free, and you will have four weeks to evaluate its worth. It embodies many years of research with the eventual goal of understanding as perfectly as possible how the market functions. I believe that I have achieved this goal.
For a FREE 4-week trial, Send an email to: ajg@cybertrails.com
For further subscription options, payment plans, and for important general information, I encourage
you to visit my website at www.marketurningpoints.com. It contains summaries of my background, my
investment and trading strategies, and my unique method of intra-day communication with
subscribers. I have also started an archive of former newsletters so that you can not only evaluate past performance, but also be aware of the increasing accuracy of forecasts.
Disclaimer - The above comments about the financial markets are based purely on what I consider to be sound technical analysis principles uncompromised by fundamental considerations. They represent my own opinion and are not meant to be construed as trading or investment advice, but are offered as an analytical point of view which might be of interest to those who follow stock market cycles and technical analysis.
Andre Gratian Archive |
© 2005-2022 http://www.MarketOracle.co.uk - The Market Oracle is a FREE Daily Financial Markets Analysis & Forecasting online publication.