


The Stock Market Timing Secret I Wish Everyone Knew
InvestorEducation / Learning to Invest Dec 10, 2014 - 05:54 PM GMTBy: Money_Morning

 Keith Fitz-Gerald writes: Many investors are trying to time the markets, especially lately with concerns over low oil prices, global woes, and Chinese growth in the headlines.
I totally get where they’re coming from. The idea of picking market tops and bottoms is very seductive.
But they may as well try to catch falling knives…
The most recent DALBAR data shows that the return of investors trying to time the markets is a pathetic 1.9% a year over the past 20 years. Worse, they would have to be right a staggering 82% of the time just to match “buy and hold” returns, according to Nobel Laureate William Sharpe.
Clearly market timing is one tactic that does not build Total Wealth. But here’s the secret.
You’re much better off trying to understand sentiment – because that’s how you identify the best and the worst times to put your money to work and rack up the biggest gains.
Today I want to teach you how to do that…
Sentiment Tells You Where Things Are Going
If you stop and think about it for a moment, tracking sentiment makes a lot of sense.
The financial markets are a construct that embodies the collective wants, desires, and aspirations of millions. As such, they reflect emotion. Therefore, if you understand what kind of “mood” they’re in, you can make the right moves ahead of time and gain the upper hand when it comes to building wealth.
One of the best ways to do that is via a technical tool called the “Put/Call Ratio.”
It’s the only tool I’ve seen in more than 30 years of analyzing markets that works consistently and accurately to predict every single one of the market’s major turning points.
The Put/Call Ratio measures sentiment by calculating the difference between thousands of puts and call options traded in the United States stock markets.
Viewed as a proportion, the ratio can be calculated on any given stock, ETF, index, or other investable instrument for which there are options traded. So you can apply it to individual securities, too.
Generally speaking, higher readings reflect excessive bearish behavior because put volume exceeds call volume. Conversely, lower readings suggest excessive bullishness because more calls are being traded.
The problem is that when you look at the data in isolation, it looks like either an EKG from hell or an earthquake tremor map.
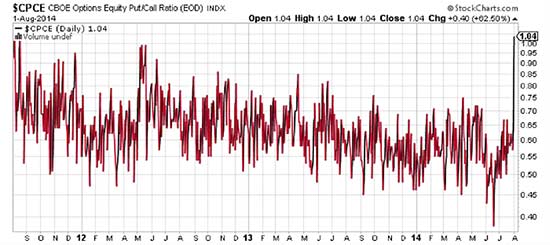
To get around that, most traders “smooth” the data over a period of time using a moving average to get what’s called a “normalized” ratio that’s not so spikey as to be useless. Day traders with short attention spans seem to like 10-15 days. Position traders may push out to 200 days or more.
I suggest you start with a 20-day period, because that’s a good approximation of the market cycles an average investor is going to encounter the majority of the time. But, again, you can lengthen or shorten this as you wish depending on your individual preferences.
There’s also something called a Weighted Put/Call Ratio. In contrast to the regular Put/Call Ratio, which captures volume only using the number of contracts traded, the Weighted Put/Call Ratio is a mathematical blend of volume and price. The thinking is that traders will spend more money as they become more emotional near market tops and bottoms.
That certainly jibes with my experience.
Here’s How to Read the Ratio (and the Advantages It Gives You)
For example, take a look at this chart that overlays the S&P 500 Index against the 20-day moving average of the Put/Call Ratio. (You can find this info yourself – absolutely free – from dozens of financial providers or simply click over to www.indexindicators.com.)
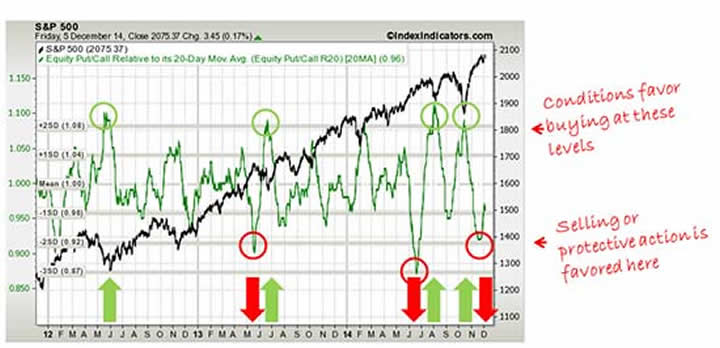
At first glance, it’s a squiggly mess. But if you relax and let the lines talk to you, a very clear picture emerges as do a few key takeaways.
- First, there have been four times the Put/Call Ratio has hit 2 standard deviations that I’ve circled in green since late 2011. Each time, the markets have moved higher because excessive bearishness is an inverse argument for a bullish reversal.
- Second, there have been three times the Put/Call Ratio has hit -2 standard deviations that I’ve circled in red. Each time, the markets have fallen because excessive bullishness is an inverse argument for a bearish reversal. Not immediately mind you, but close enough for government work as the old expression goes.
Here’s the thing. Knowing how to read this chart would have…
… allowed you to capture every single one of the market’s major turning points since 2012; and
… help you know when conditions favored buying or selling.
If you’re like a lot of people, you may be kicking yourself right about now because you’re imagining how much more money you could have made or could be making. That’s perfectly normal (and a valuable part of learning, too).
So what’s the Put/Call Ratio telling us now?
Let’s take a closer look together and see.
What the Put/Call Ratio Says Today
Right away we see that the S&P 500 Index is topping out. To my naked eye it appears to be losing momentum and seems like it wants to roll over like a Slinky that you may have played with as a kid going down the stairs.
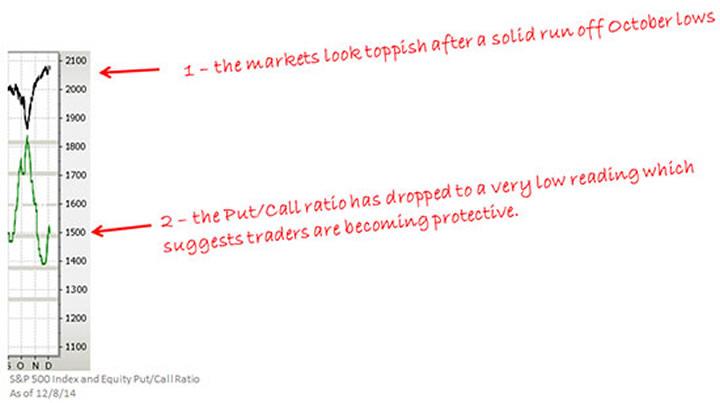
A quick look at the Put/Call Ratio and I see that it dropped a full two standard deviations below its normal range at the beginning of December.
We know from past history (and our second chart) that this is a reading consistent with short-term turning points so this tells us we immediately want to be on guard.
At the same time, it also suggests that we want to check our trailing stops. There’s no sense in letting a reversal catch you by surprise, especially since the Put/Call Ratio has told you that this is a possibility for the better part of a month in advance.
Anecdotally, this makes all kinds of sense coming into the holidays. Volumes are getting thinner by the minute as traders the world over get ready to take some time off.
The other thing that stands out when I look at the data is a great opportunity for aggressive traders. I call this “capitalizing on chaos” because you’re using this information to make money at a time when other investors are blindsided.
For example, I recently recommended my paid Strike Force subscribers short a media darling that’s making its share of headlines right now – or consider buying put options as a means of doing just that. So far the short has returned 17% while the put options are up 212.40% as I write this.
I’ll be back Friday to let you in on that… and continue the discussion.
Best regards until next time,
Keith
Source : http://totalwealthresearch.com/2014/12/secret-market-timing-wish-everyone-knew/#deeplink
Money Morning/The Money Map Report
©2014 Monument Street Publishing. All Rights Reserved. Protected by copyright laws of the United States and international treaties. Any reproduction, copying, or redistribution (electronic or otherwise, including on the world wide web), of content from this website, in whole or in part, is strictly prohibited without the express written permission of Monument Street Publishing. 105 West Monument Street, Baltimore MD 21201, Email: customerservice@moneymorning.com
Disclaimer: Nothing published by Money Morning should be considered personalized investment advice. Although our employees may answer your general customer service questions, they are not licensed under securities laws to address your particular investment situation. No communication by our employees to you should be deemed as personalized investent advice. We expressly forbid our writers from having a financial interest in any security recommended to our readers. All of our employees and agents must wait 24 hours after on-line publication, or after the mailing of printed-only publication prior to following an initial recommendation. Any investments recommended by Money Morning should be made only after consulting with your investment advisor and only after reviewing the prospectus or financial statements of the company.
Money Morning Archive |
© 2005-2022 http://www.MarketOracle.co.uk - The Market Oracle is a FREE Daily Financial Markets Analysis & Forecasting online publication.