


The 2014 Crude Oil Price Crash Explained
Commodities / Crude Oil Nov 24, 2014 - 05:20 PM GMTBy: Raul_I_Meijer

 This is an article by our good friend Euan Mearns at the University of Aberdeen. It was originally published here .
- In February 2009 Phil Hart published on The Oil Drum a simple supply demand model that explained then the action in the oil price. In this post I update Phil’s model to July 2014 using monthly oil supply (crude+condensate) and price data from the Energy Information Agency (EIA).
- This model explains how a drop in demand for oil of only 1 million barrels per day can account for the fall in price from $110 to below $80 per barrel.
- The future price will be determined by demand, production capacity and OPEC production constraint. A further fall in demand of the order 1 Mbpd may see the price fall below $60. Conversely, at current demand, an OPEC production cut of the order 1 Mbpd may send the oil price back up towards $100. It seems that volatility has returned to the oil market.
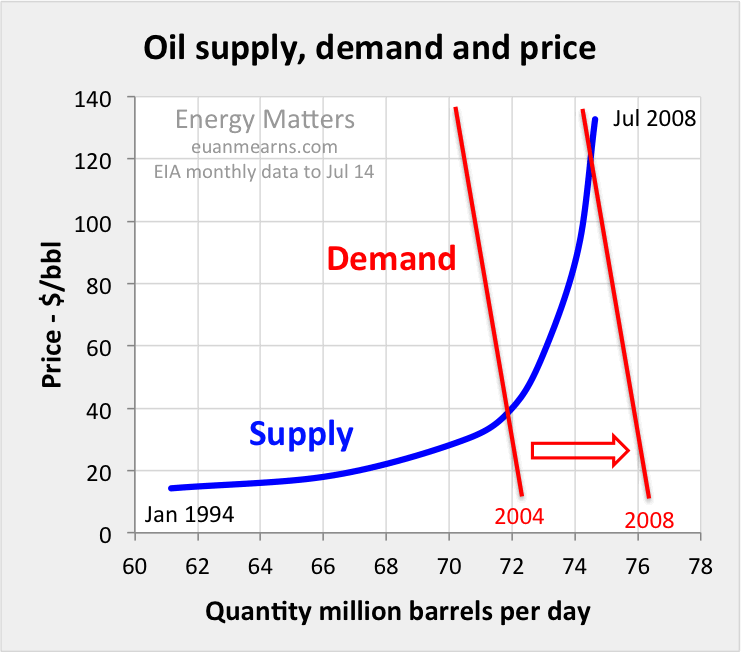
Figure 1 An adaptation of Phil Hart’s oil supply demand model. The blue supply line is constrained by data (see Figure 4). The red demand lines are conceptual. Prior to 2004, oil supply was fairly elastic to changes in price, i.e. a small rise in price led to a large rise in production. This is explained by OPEC opening and closing the taps. Post 2004, oil supply became inelastic to price, i.e. a large change in price led to marginal increase in supply. This is explained by the world pumping flat out. Demand tends to be fairly inelastic and inversely correlated with price in that high price suppresses demand a little. Supply and price at any point in time is defined by the intersection of the supply and demand curves. 72 Mbpd and $40 / bbl in 2004 became 76 Mbpd and $120 / bbl in 2008 as demand for oil soared against inelastic supply.
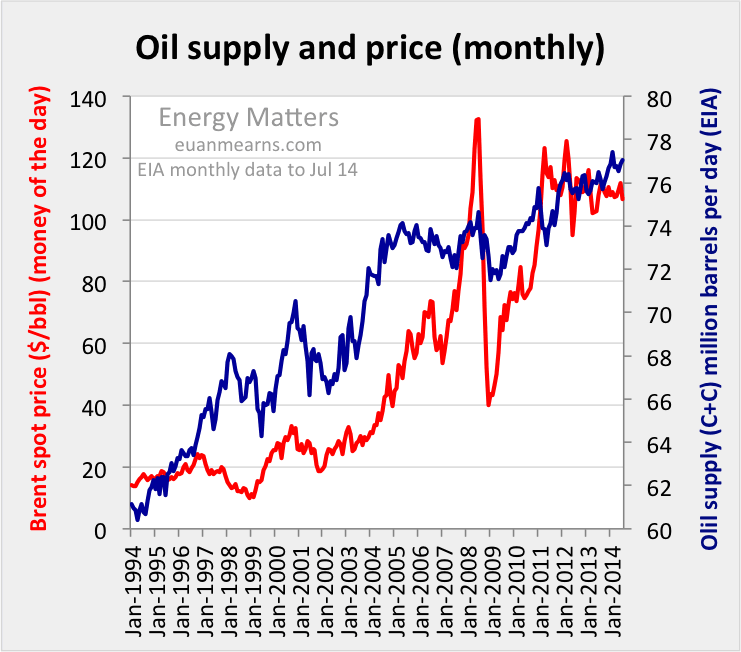
Figure 2
Followers of the oil market will be familiar with the recent evolution of oil supply and price shown in Figure 2.
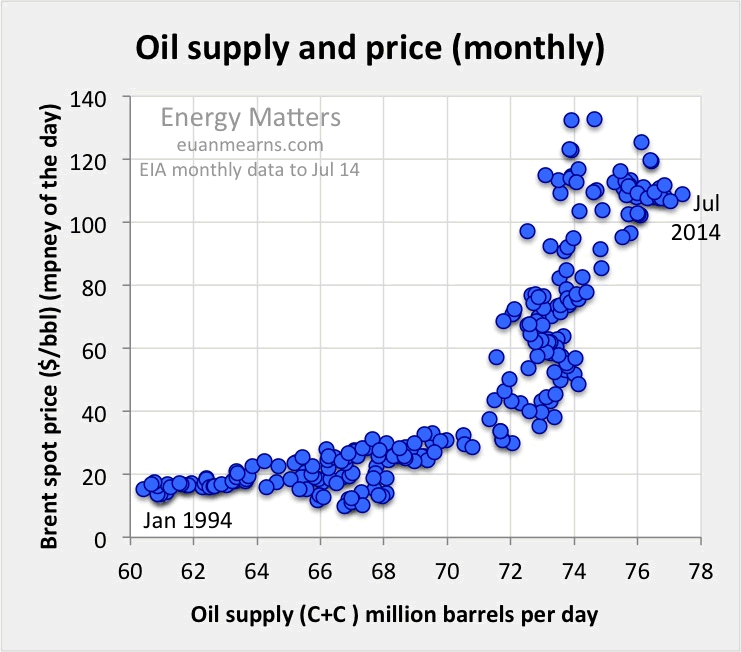
Figure 3
What is less widely appreciated is that a cross plot of the data shown in Figure 2 results in the well-ordered relationship shown in Figure 3. Oil supply and price are clearly following some well established rules. This relationship led to Phil Hart developing his model shown as Figure 1.
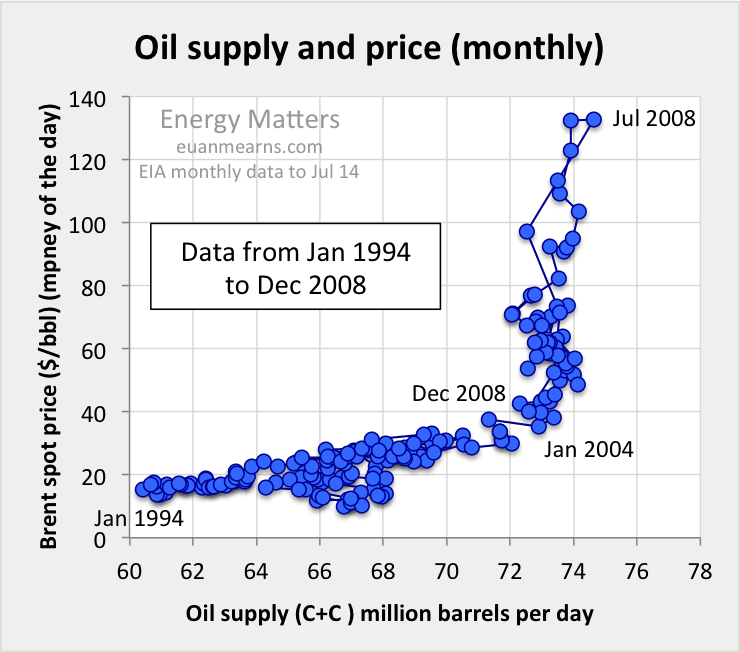
Figure 4
Separating the data into two time periods brings more clarity to the process at work. The data define a fairly well-ordered time series beginning at January 1994 at the bottom left rising slowly to January 2004 and then steeply to the Olympic Peak of July 2008. The financial crash then caused the oil price to give up all of its gains returning to 2004 levels by December 2008.
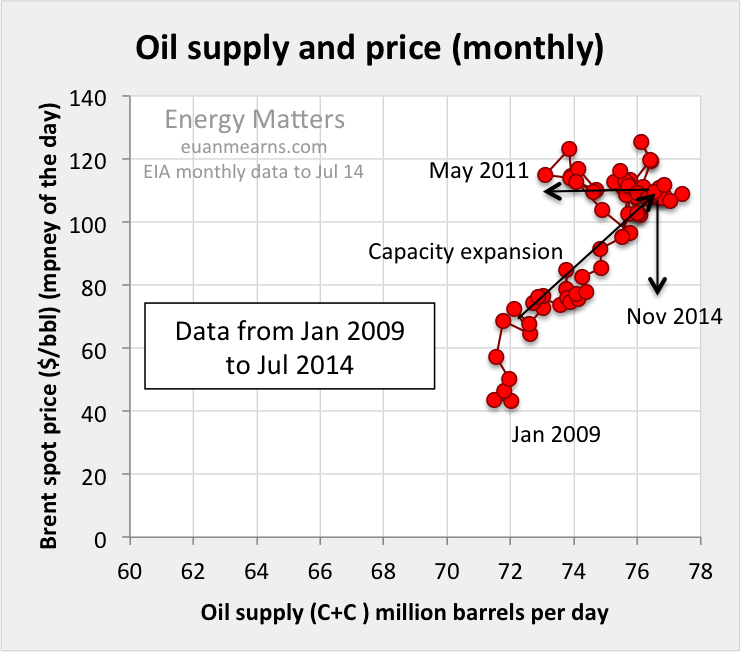
Figure 5
The second time period from January 2009 to the present shows some different forces at work. Starting in 2009 some new production capacity was built. This was not in OPEC and is concentrated in N America where the light tight oil (LTO) boom took off supplemented by steady expansion of tar sands production. Prior to 2009, the production peaks were of the order 74 Mbpd. Post 2009 peaks of the order 77 Mbpd were achieved. About 3 Mbpd new capacity has been added. In May 2011 there is a significant and curious excursion to lower production not accompanied by a fall in price. This coincides with Libya coming off line for the first time and the loss of 1.6 Mbpd production. It seems possible that this coincided with weak demand and the fortuitous loss of production cancelling weak demand leaving price unchanged.
The EIA are always running a few months behind with their statistics these days, not ideal in a rapidly changing world. Thus we do not yet have the data to see the recent crash in the oil price. But we know the price has fallen below $80 and production is unlikely to be significantly changed. So, how do we explain production of roughly 77 Mbpd and a price below $80?
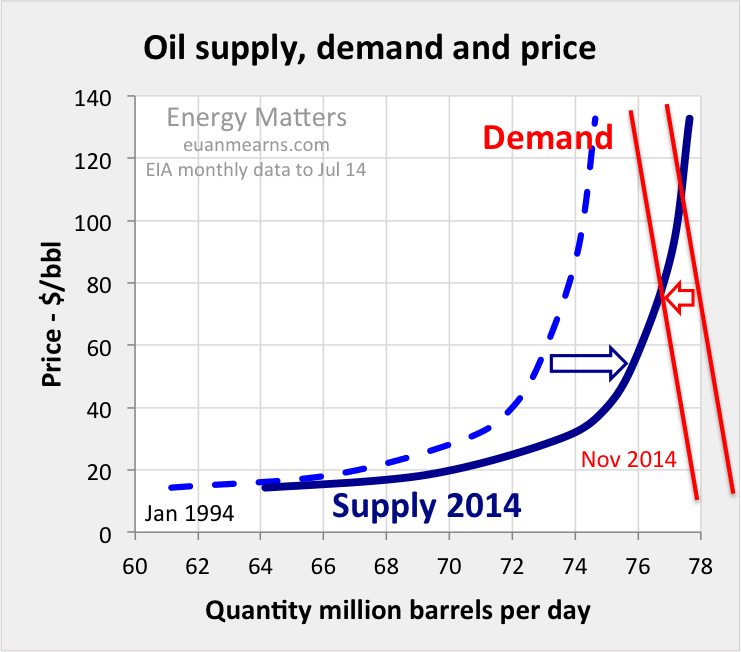
Figure 6
Figure 6 updates Phil Hart’s model (Figure 1) to take account of the oil supply and price movements of the last 5 years. Capacity expansion is achieved by adding 3 Mbpd to the former, well-defined supply-price curve (blue arrow). There is no a-priori reason that this curve should hold in the new supply-price regime, but for the time being that is all I have to work with. The red lines, as described in the caption to Figure 1, conceptually represent inelastic demand where high price marginally suppresses demand for oil. The recent past has seen oil priced at $110 with supply running at about 77 Mbpd as defined by the right hand red coloured demand curve. Reducing demand by about 1 Mbpd brings the price below $80 / bbl (red arrow).
The Recent Past and the Future
Old hands will know that it is virtually impossible to forecast the oil price. The anomalous recent price stability of $110±10 I believe reflects great skill on the part of Saudi Arabia balancing the market at a price high enough to keep Saudi Arabia solvent and low enough to keep the world economy afloat. The reason Saudi Arabia has not cut production now, when faced with weak global demand for oil, probably comes down to their desire to maintain market share which means hobbling the N American LTO bonanza. Alternatively, they could be conspiring with the USA to wreck the Russian economy? But Saudi Arabia is not the only member of OPEC and the economies of many of the member countries will be suffering badly at these prices and that ultimately leads to elevated risk of civil unrest. It is not possible to predict the actions of the main players but it is easier to predict what the outcome may be of certain actions.
- If demand for oil weakens by about a further 1 Mbpd this may send the price down below $60 / bbl.
- If OPEC cuts supply by about 1 Mbpd at constant demand this may send the price back up towards $100 / bbl.
- Prolonged low price may see LTO production fall in N America and other non-OPEC projects shelved resulting in attrition of non-OPEC capacity. This may take one to two years to work through but with constant demand, this will inevitably send prices higher again.
- Prolonged low price may see many specialist LTO producers default on loans, risking a new credit crunch and reduced LTO production. This would likely lead to a major consolidation of operators in the LTO patch where the larger companies (the IOCs) pick up the best assets at knock down prices. That is the way it has always been.
- Black Swans and elephants in the room – with conflict escalation in Ukraine and / or Syria-Iraq and a new credit crunch, all bets will be off.

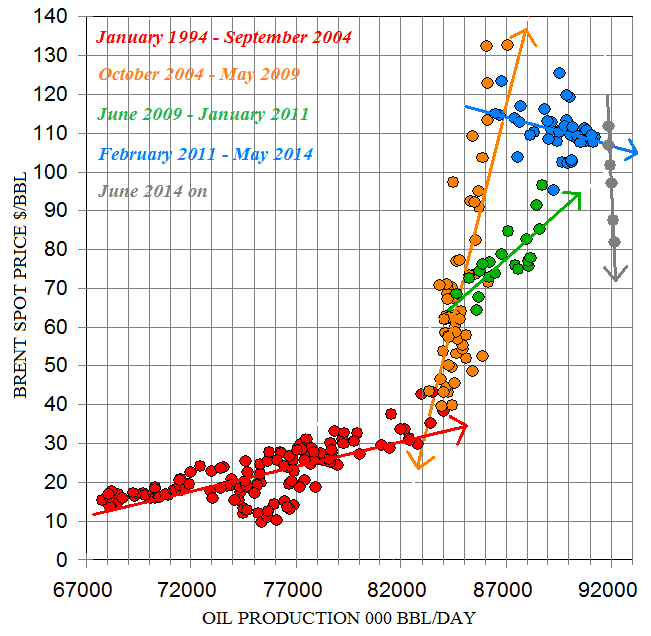
[Ilargi:] And this comment to the article from Euan’s friend and collaborator Roger Andrews certainly warrants attention as well. (check the grey dots!):
Hi Euan:
I put this XY plot of the data together from the data links you supplied. It shows the same trends as your Figures except that I’ve plotted all the points on one graph and segregated them into five periods, with trend lines and arrows showing the overall “direction of travel” for each (arrows in both directions for October 2004-May 2009, which as you noted goes zooming up and then comes right back down again).
I’ve also projected production data for the missing months since May 2014 (shouldn’t be too far off) so that we can at least get an idea of how the latest trend might compare with the old ones. We seem to be in uncharted territory.
By Raul Ilargi Meijer
Website: http://theautomaticearth.com (provides unique analysis of economics, finance, politics and social dynamics in the context of Complexity Theory)
Raul Ilargi Meijer Archive |
© 2005-2022 http://www.MarketOracle.co.uk - The Market Oracle is a FREE Daily Financial Markets Analysis & Forecasting online publication.