


Stock Market Inflection Point
Stock-Markets / Stock Markets 2014 Nov 15, 2014 - 03:23 PM GMTBy: Tony_Caldaro

 A quiet week as the market remains in drift higher mode. Monday and Tuesday we saw marginal new highs, a pullback Wednesday, then new highs again on Thursday. For the week the SPX/DOW were +0.4%, the NDX/NAZ were +1.4%, and the DJ World index rose 0.5%. Economic reports for the week were biased to the downside. On the uptick: business/wholesale inventories, consumer sentiment and retail sales. On the downtick: export/import prices, long term investor sentiment, the monetary base, the WLEI, plus weekly jobless claims and the budget deficit were higher. Next week we get the FOMC minutes, Capacity utilization, the CPI/PPI and housing.
LONG TERM: bull market
With this bull market now fully into its 68th month, the third longest in modern history, the dynamics appear to have changed. Since the bear market low in March 2009 this market had risen higher with the FED spoon feeding it liquidity. At no time, in the prior 67 months, had this market made higher highs without either a FED liquidity program underway or pledged. In fact, in anticipation of QE 1 ending the market dropped 17%. It only bounced off the lows when QE 2 was rumored and then announced. In anticipation of QE 2 ending the market dropped 22%. Then it made a double bottom only after Operation Twist 1 was announced. Operation Twist 2 was announced just as OT 1 was ending, and the market continued higher. When OT 2 was about to end the FED started QE 3, and again the market continued higher.
Over the entire 67 months there were only two periods when a FED liquidity program was ending, and nothing was announced suggesting another one to follow. Those two periods saw the market drop 17% and 22% respectively. Recently in anticipation of QE 3 ending the market dropped 10%. Surprisingly, however, the market quickly turned around and made new highs without any announcement of another program pending. In fact, the FED has been suggesting, when the time is right, they will be raising short term rates. Something they have not done since 2006. It appears, from this view at least, the dynamics of this bull market have changed.
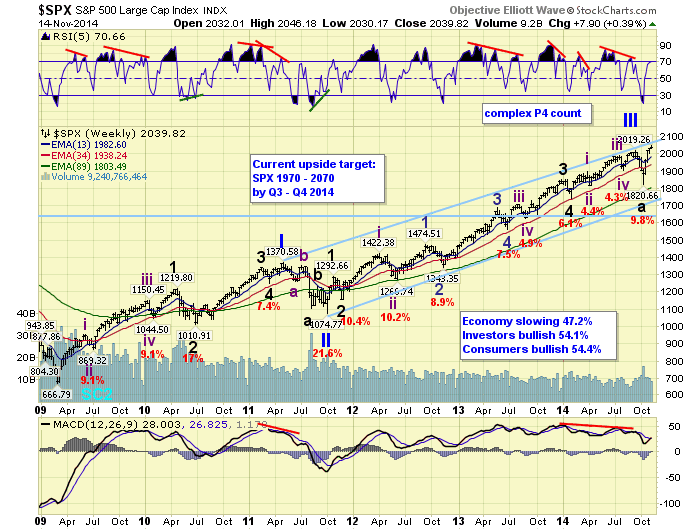
We continue to count this bull market as Cycle wave [1] of a new Super cycle, multi-generational, bull market. The last Super cycle bull market unfolded in five Cycle waves and lasted from 1932-2007. There will be bull and bear markets, quite a few, along the way. But no bears markets, like the one we just experienced, until the entire Super cycle ends. Each rising Cycle wave unfolds in five Primary waves. Primary waves I and II of this Cycle wave [1] occurred in 2011. We had initially thought Primary III ended in September, just prior to the ending of QE 3 in October. The market did correct 10%. But with the recent uptrend to new highs Primary III may be extending yet again.
MEDIUM TERM: uptrend
After projecting that Primary III topped in mid-September at SPX 2019, we expected a 15% to 20% decline for Primary IV. The market did decline about 10%, it largest correction since 2012, then immediately turned around and started to uptrend. The uptrend, we thought, was just a B wave of a multi-month Primary IV. However, when it nearly made new highs, two weeks ago, we offered an alternate count. The alternate count suggested that Primary III was continuing to extend.
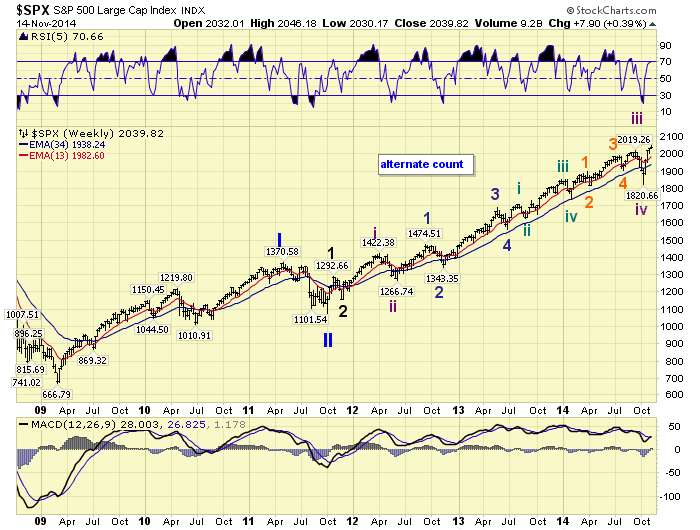
For the past two weeks we have carried both counts, giving the alternate a 55%/45% advantage, since the uptrend looked impulsive and the market was making marginal new highs. For the past two weeks, however, the market has only managed to gain about 1%. Prior to that, off the downtrend low, it was gaining about 3% per week. During the last two weeks we have been patiently awaiting to see how the internal structure of this uptrend unfolds. Despite the new highs, if it rallied in three waves, it would be corrective, and probably wave B of Primary IV. If it rallied in five waves, it would be impulsive, and probably an extension of Primary III.
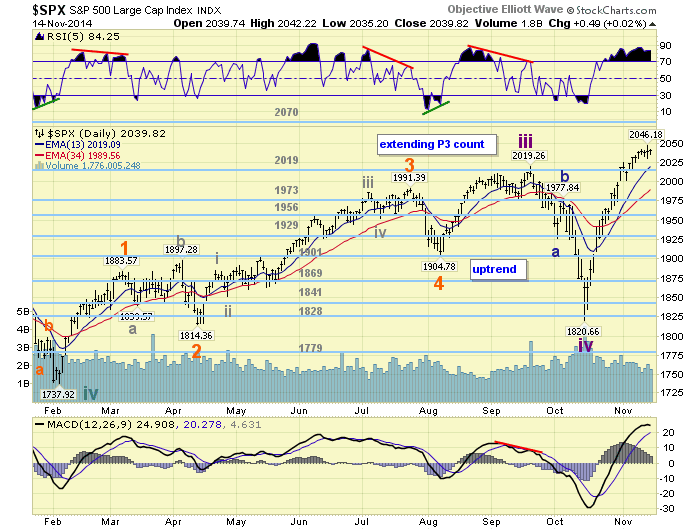
During the entire uptrend it had been difficult for us to somewhat quantify the advance. This week, however, that changed. We now see two five wave advances from the downtrend low at SPX 1821 to 2046. Should this be all of this uptrend, then Primary IV is likely to resume before this market makes new highs. Should the market continue to make new highs then it is likely an impulsive five wave structure in an ongoing Primary III. Next week may confirm one way or the other. Medium term support is at the 2019 and 1973 pivots, with resistance at the 2070 and 2085 pivots.
SHORT TERM
This week we updated our SPX hourly chart to display a three wave structure from the SPX 1821 downtrend low, up to the high at 2046: 1898-1878-2046. This structure could either be an a-b-c or a 1-2-3. If an a-b-c, the market should rollover and head lower. If a 1-2-3, we should complete a small pullback for wave 4, and then make higher highs during wave 5.
Thus far, we do not see the typical negative divergences that have occurred during recent uptrend highs. The last five uptrend highs have all been accompanied by negative RSI divergences on the daily chart. There have been uptrends, during this bull market, that peaked without a divergence. So for now we need to rely more on price activity.
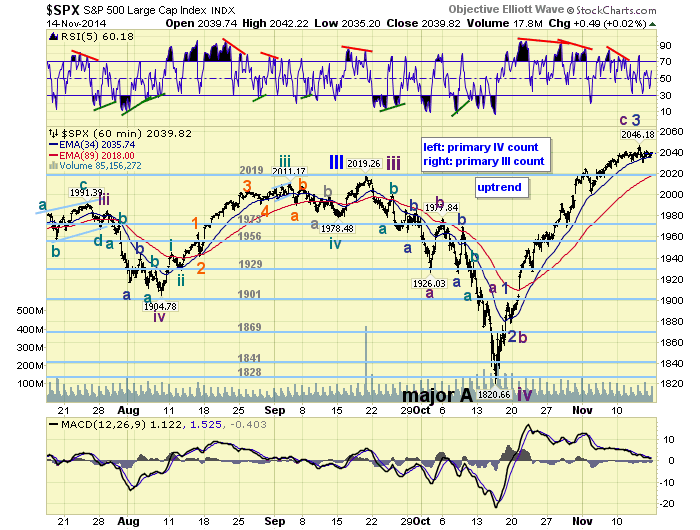
Should the market drop below SPX 2000 it would clearly represent the largest pullback since the uptrend began. This would suggest, from the recent high, a Major C wave may be underway. However, a drop below the OEW 1973 pivot range would be more convincing. Should the market continue on to new highs, we see the 2070 and 2085 pivots offering significant resistance in the days/weeks ahead. Until one or other occurs it makes little sense to us speculating on the level of the next downtrend. Short term support is at the 2019 pivot and SPX 2000, with resistance at SPX 2049 and the 2070 pivot. Short term momentum ended the week around neutral. Best to your FOMC/OPEX trading next week!
FOREIGN MARKETS
Asian markets were mostly higher on the week gaining 1.3%.
European markets were quite mixed on the week losing 0.1%.
The Commodity equity group was also mixed losing 0.8%
The DJ World index gained 0.5%.
COMMODITIES
Bonds remain in a downtrend losing 0.3% on the week.
Crude remains in a downtrend losing 3.3% on the week.
Gold remains in a downtrend too but gained 0.6% on the week.
The USD is still in an uptrend but lost 0.1% on the week.
NEXT WEEK
Monday: the NY FED at 8:30, then Industrial production at 9:15. Tuesday: PPI, the NAHB index, and Congressional testimony from FED advisor Sullivan. Wednesday: Housing starts, Building permits and the FOMC minutes. Thursday: weekly jobless claims, the CPI, Existing home sales, the Philly FED, Leading indicators, and a speech from FED governor Tarullo. Friday: Options expiration.
CHARTS: http://stockcharts.com/public/1269446/tenpp
http://caldaroew.spaces.live.com
After about 40 years of investing in the markets one learns that the markets are constantly changing, not only in price, but in what drives the markets. In the 1960s, the Nifty Fifty were the leaders of the stock market. In the 1970s, stock selection using Technical Analysis was important, as the market stayed with a trading range for the entire decade. In the 1980s, the market finally broke out of it doldrums, as the DOW broke through 1100 in 1982, and launched the greatest bull market on record.
Sharing is an important aspect of a life. Over 100 people have joined our group, from all walks of life, covering twenty three countries across the globe. It's been the most fun I have ever had in the market. Sharing uncommon knowledge, with investors. In hope of aiding them in finding their financial independence.
Copyright © 2014 Tony Caldaro - All Rights Reserved Disclaimer: The above is a matter of opinion provided for general information purposes only and is not intended as investment advice. Information and analysis above are derived from sources and utilising methods believed to be reliable, but we cannot accept responsibility for any losses you may incur as a result of this analysis. Individuals should consult with their personal financial advisors.
Tony Caldaro Archive |
© 2005-2022 http://www.MarketOracle.co.uk - The Market Oracle is a FREE Daily Financial Markets Analysis & Forecasting online publication.