


Destroy A Currency, Extend A Stock Market Rally
Stock-Markets / Stock Markets 2014 Nov 08, 2014 - 06:14 PM GMTBy: Doug_Wakefield

 What was I thinking? Goodbye All Time Highs? I must have lost my mind to have forgotten that central bankers have unlimited tools to inflate stock bubbles.
Actually, the last 2 weeks have only shown me even more, how desperate the actions of central banks, and how passionate the majority of traders just to hear the words, "all time high" one more time.
But as always, I encourage you NOT to take my word or my opinion, but to think for yourself. Is it really worth a few more days of a power rally, solely at the continued expense of a nation's currency and entire economy?
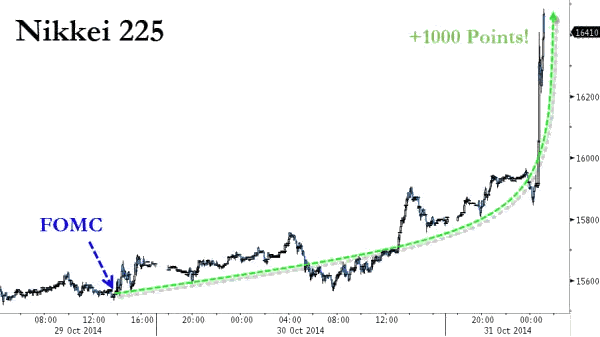
Source - Markets Explode Higher As Bank of Japan Goes All-In-er; Increases QE To JPY 80 Trillion, Zero Hedge, Oct 31 '14
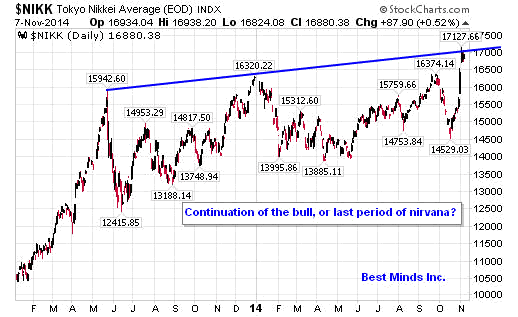
First, we can see from the chart above, that an announcement made the Bank of Japan to increase yet once again their debt load and direct purchases of their own stock market, contributed to the 1,000 points rally in under a day. That's right, by printing up more debt out of thin air, and tripling their purchases of exchange traded funds based on the Nikkei, we have "victory". But at what costs?
Considering the fact that this announcement was made on Oct 31st, and two days earlier the Federal Reserve's QE program would go to zero effective November 1st, the next "support" for the stock bubble by the global central bankers certainly arrived quickly.
Fed Ends 6 - Year Effort To Stimulate Economy, CNN Money, Oct 29 '14
Bank of Japan Sails Further Into Uncharted Territory, WSJ, Oct 31 '14
When looking at some indicators of "extreme happiness" coming in this last week, it would seem that the "nirvana effect" for stocks roared back even stronger than the price movement of US and Japanese stocks.
The bearish percentage of AAII (American Association of Individual Investors) survey dropped to a multi-year low of 15%, Investor's Intelligence reported that newsletter bulls jumped the most in 40 years, and investors poured $17 billion into S&P 500 exchange traded funds over the two weeks ending on Oct 31st, marking a 4 year high.*
So how could I have been so foolish two weeks ago, to have stated "Goodbye All Time High" in the title of an article. Actual, it is simple. I had believed then, as I do even more now, that time was running out on "all time high" stock headlines. As of today, since that has already occurred again, the question now becomes, "So now what?" Are things once again "back to normal"?
Are we mad? Do any of these "experts" ever consider the longer-term problem of selling these ever expanding war chests of assets owned by the Bank of Japan...or European Central Bank, or Federal Reserve, etc, etc? After six years of these same tricks, in an attempt to convince the public that wilder speculation is equal to economic growth, isn't it time to admit that printing up even MORE debt, is a negative rather than a positive for the long term success of capital markets or the economic life of nations? Of course, who wants to look for long-term solutions, when you can create the "image" of financial "success" in a day.
For 6 years, the world's central banks have acted in the role of "purchaser of last resort", adding trillions in additional debt to the nation states of the world, and placing an even larger drag on global economic growth.
While the last 3 weeks have produced the image of "unstoppable bull", it has also followed a great lesson one of my subscribers, a professional trader, shared with me several years ago. The idea; when you look at where money is going into or leaving, look at other markets in the world to determine where that money could be following a totally opposite path.
So in a world focused on "stocks always go up because central bankers have our backs", let me turn to Albert Edwards, Co-Head of Global Strategy at Societe Generale, and a chart of where money was EXITING.
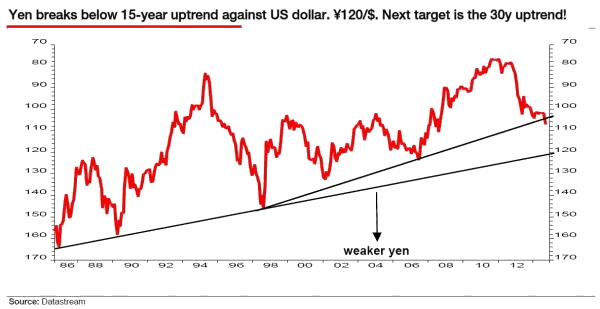
Source - Albert Edwards Presents "The Most Important Chart for Investors", ZH, Sept 22 '14, repeated again in "The Most Important Chart for Investors" Flashback, and Why USDJPY 120 Is Now Coming Fast, ZH, Oct 31 '14
The top price in the strengthening yen trend was attained on Oct 27, 2011. With this in mind, the big move down in the yen, and up in the Nikkei last Friday, Oct 31st, must be seen as a desperate attempt to keep "pushing on a string", or a trend that has already been in place for 3 years. The holdings by the commercial hedgers -the very well financed money - have also been showing extremes in the US dollar, euro, and yen over the last couple of months, and anyone who understands futures, understands that when the commercial hedgers are at extremes, it is the crowd that has managed to find themselves at the total opposite end of the seesaw.
On Thursday, Oct 30th, the USDJPY stood at 108.73. Today, six trading days later, it stood at 115.57. Clearly, if this trend does continue at this pace, the yen would hit its 30-YEAR trendline of 120 in another week or so. Then what?
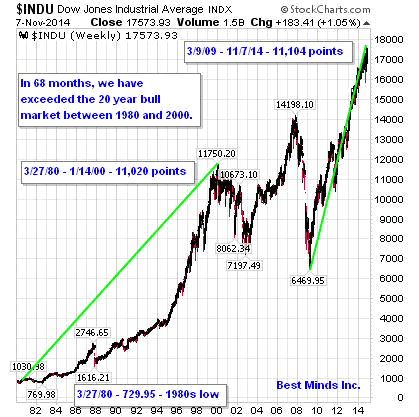
Either way, the extreme volatility we have watched since the Sept 19th high, continues to remind us that it would be very naïve at this stage in a 68-month rally from the March 2009 bottom to expect an ending stream of "all time high" headlines, with no longer term market consequences. At some point, central bankers must face the reality of acting as "purchasers of last resort" for the last six years.
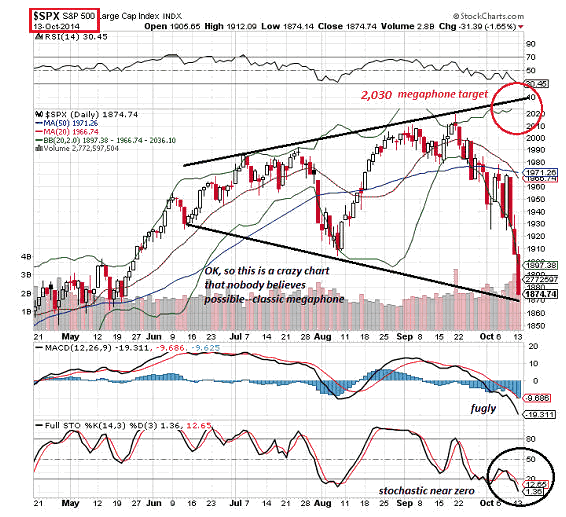
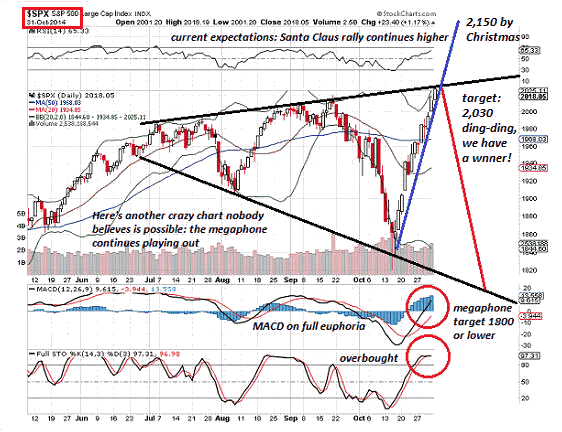
Source of two chart of the S&P 500 was Charles Hugh Smith in his recent article, About that "S&P Will Be 2,150 by Christmas" Call, Nov '14.
"Vogue editor Diana Vreeland's motto, 'Fake it, fake it', is now the First Commandment of the spin-doctor and the commercial maker. As Vreeland advises, 'Never worry about the facts. Project an image to the public.' The art of success is to create a world 'as you feel it to be, as you wish it to be, as you wish it into being.'" When No One Sees: The Importance of Character in an Age of Image (2000), Os Guinness, pg 2.2
Isn't it time to "worry about the facts"?
Careful What You Wish For: Plunging Yen Leads to 140% Surge in Bankruptcies, ZH, Oct 30 '14
* The stats were pulled from the home page of www.sentimentrader.com.
Complacency Time Has Gone
If you have no experience in growing money on the downside of a financial bubble, I cannot think of a better time to subscribe to The Investor's Mind. It is amazing with all the hype given "another all time high" since the start of 2013, how little attention has been given to various world markets that have not returned to that level since reaching it in 2008, 2000, and yes, even 1990.
The cost for procrastination is rising rapidly, and the value for good research becoming extremely low in comparison to the speed in which wealth can be destroyed. Click here to start the next six months reading the newsletters and trading reports as we come through this incredible period in market history, and attain my latest special edition of The Investor's Mind: At the Top of the World. This issue, completed on Oct 23rd, will be completely revised two weeks from today, November 21st, when monthly equity options expire.
Doug Wakefield
President
Best Minds Inc., a Registered Investment Advisor
2548 Lillian Miller Parkway
Suite 110
Denton, Texas 76210
www.bestmindsinc.com
doug@bestmindsinc.com
Phone - (940) 591 - 3000
Alt - (800) 488 - 2084
Fax - (940) 591 –3006
Copyright © 2005-2011 Best Minds Inc.
Best Minds, Inc is a registered investment advisor that looks to the best minds in the world of finance and economics to seek a direction for our clients. To be a true advocate to our clients, we have found it necessary to go well beyond the norms in financial planning today. We are avid readers. In our study of the markets, we research general history, financial and economic history, fundamental and technical analysis, and mass and individual psychology.
Disclaimer: Nothing in this communiqué should be construed as advice to buy, sell, hold, or sell short. The safest action is to constantly increase one's knowledge of the money game. To accept the conventional wisdom about the world of money, without a thorough examination of how that "wisdom" has stood over time, is to take unnecessary risk. Best Minds, Inc. seeks advice from a wide variety of individuals, and at any time may or may not agree with those individual's advice. Challenging one's thinking is the only way to come to firm conclusions.
Doug Wakefield Archive |
© 2005-2022 http://www.MarketOracle.co.uk - The Market Oracle is a FREE Daily Financial Markets Analysis & Forecasting online publication.