


Don't Be Spooked by Stock Market Volatility - Investor Opportunity Is Still Knocking!
Stock-Markets / Stock Markets 2014 Nov 04, 2014 - 04:52 PM GMTBy: Frank_Holmes

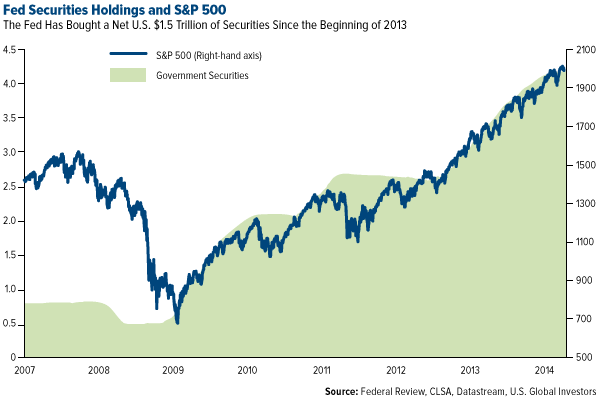
 One of the greatest fears this October--possibly the most volatile month of the year--has been the correlation between the S&P 500 Index's ascent in the first three quarters of the year and the possible ramifications of the end of quantitative easing (QE).
It's well known that Japan and Singapore have been buying their countries' blue chip stocks with their excessive money printing. Today, about 1.8 percent of the Japanese market is owned by the Bank of Japan. American investors fear the Federal Reserve might do the same and take away the punch bowl, so to speak.
As you can see, the S&P 500 Index has been rising in tandem with government securities, and it's uncertain what will happen when QE ends.
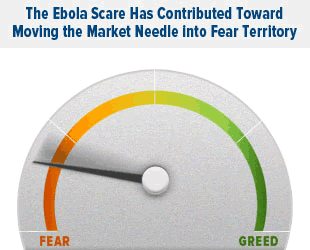
The Ebola epidemic has also contributed toward moving the needle to the fear side of the spectrum and driven investors to seek shelter not in gold necessarily but in so-called "Ebola stocks." For every negative, as tragic as they often are, there is a positive. When a major hurricane hits Florida, for instance, insurance stocks fall while real estate stocks rise. The deadly Ebola virus, on top of an aging demographic, has helped make health care and biotechnology pop this year. The Daily Reckoning's Paul Mampilly, in fact, calls this rally "the biggest biotech market ever."
Possibly. Before we get too excited, let's look at the numbers. Over the last 10 years, the S&P 500 Biotechnology Index has had a rolling 12-month percentage change of ±23. As of this writing, the index is up 32 percent, meaning it's up by only 1.3 standard deviation. In other words, biotech is behaving approximately within its expected range.
Gold bullion, over the same period, has had a percentage change of ±19--not so dramatically different from biotech--and is down by 1.3 standard deviation. Again, this is "normal" behavior.
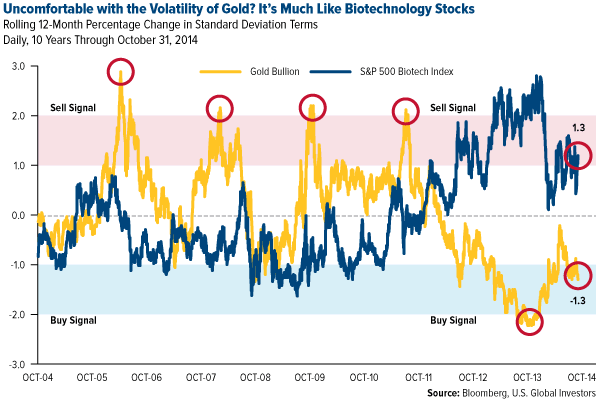
As you can see, biotech corrected and then rallied firmly into the sell zone. Seventy percent of the time, it's normal for the asset class to rise and fall one standard deviation. Each asset class has had its own DNA of volatility over the last 10 years. Knowing this helps you manage your expectations of how they perform.
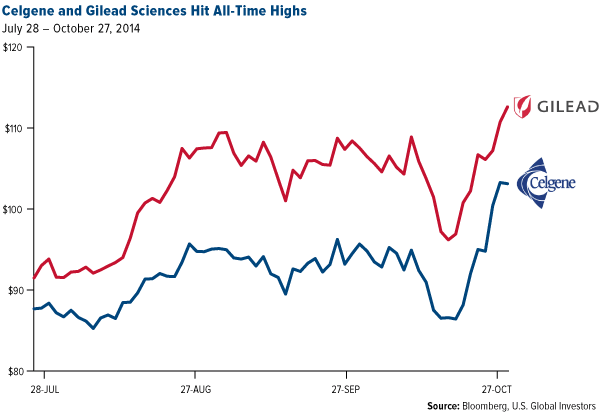
Even health care and biotech companies not actively working toward finding treatments and vaccines for the virus seem to have incidentally benefited from the rally. California-based Gilead Sciences and New Jersey-based Celgene, for instance--both of which we own in our All American Equity Fund (GBTFX) and Holmes Macro Trends Fund (MEGAX) and were named by Motley Fool as two of the four most important stocks of the last 16 years--have hit all-time highs. Gilead Sciences concentrates mostly on drug therapies for HIV and hepatitis B, while Celgene conducts similar work for cancer and inflammatory disorders.
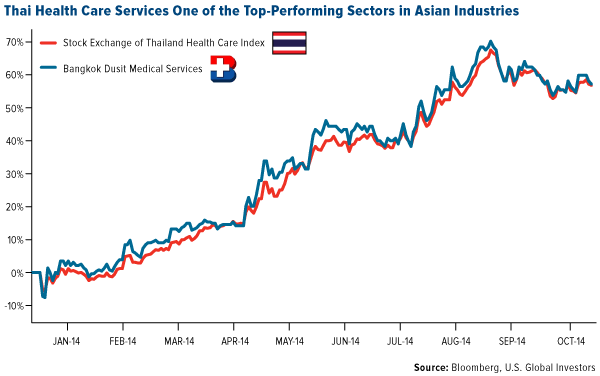
And it's not just American health care stocks that are doing well. We've been impressed lately with the performance of the Stock Exchange of Thailand Health Care Index and Bangkok Dusit Medical Services, Thailand's largest private hospital operator, which we hold in our China Region Fund (USCOX). Both the index and the equity have excelled year-to-date, delivering 57 percent.
Bullion and Gold Stocks
As for gold, between mid-August and October 3, the precious metal completely ignored the fact that September is historically its best-performing month, tumbling 9 percent from $1,310 to $1,190. It soon rebounded in the days leading up to Diwali.
Gold stocks, on the other hand, have yet to recover. Since the end of August, the NYSE Arca Gold BUGS Index has plunged 25 percent to lows we haven't seen since April 2005. The Market Vectors Junior Gold Miners ETF has lost nearly 30 percent; the Philadelphia Gold and Silver Index (XAU), 25 percent.
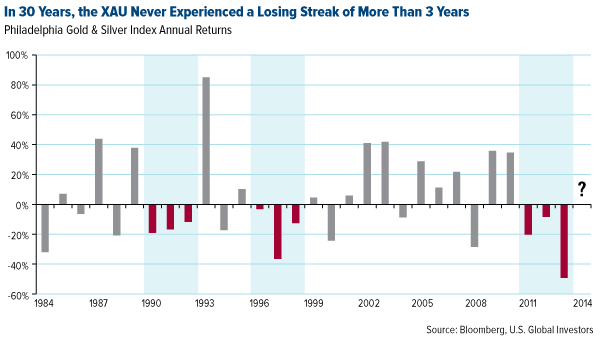
On a few occasions I've pointed out that in the last 30 years, the XAU has never experienced a losing streak of more than three years. As of this writing, it's lost close to 17 percent, with only two months left. The cards are definitely stacked against the XAU, but I remain optimistic it can continue the trend.
Many investors are understandably concerned that mining companies in West Africa will suffer because of Ebola. Several companies operating in the three hardest-hit countries have indeed been hurt by the virus, some of them being forced to halt production. However, none of our funds has any direct exposure to them. Three companies that we own in our Gold and Precious Metals Fund (USERX) and World Precious Minerals Fund (UNWPX) --IAMGOLD, Newmont Mining and Randgold Resources--continue to operate normally in the region.
Here I must remind investors that we recommend 10-percent holding in gold: 5 percent in bullion, 5 percent in stocks. Rebalance every year.
Looking Past Ebola
One of our most important tenets at U.S. Global is to always stay curious. That includes being familiar with world events and determining how they might affect our funds. Ebola certainly falls into this category, but that doesn't necessarily mean our funds will undergo any significant changes based on this unfortunate event. Again, other factors have contributed, including the so-called October effect. We remain committed to our fundaments and pick stocks because they've been well-screened and fit in our results-oriented models.
If the markets seem too volatile for you right now, we're proud to offer investors a "no-drama" alternative. Check out our Near-Term Tax Free Fund (NEARX), which has delivered positive returns for the past 13 years.
Happy investing, and stay safe!
Want to receive more commentaries like this one? Sign up to receive email updates from Frank Holmes and the rest of the U.S. Global Investors team, follow us on Twitter or like us on Facebook.
By Frank Holmes
CEO and Chief Investment Officer
U.S. Global Investors
U.S. Global Investors, Inc. is an investment management firm specializing in gold, natural resources, emerging markets and global infrastructure opportunities around the world. The company, headquartered in San Antonio, Texas, manages 13 no-load mutual funds in the U.S. Global Investors fund family, as well as funds for international clients.
All opinions expressed and data provided are subject to change without notice. Some of these opinions may not be appropriate to every investor.Standard deviation is a measure of the dispersion of a set of data from its mean. The more spread apart the data, the higher the deviation. Standard deviation is also known as historical volatility. All opinions expressed and data provided are subject to change without notice. Some of these opinions may not be appropriate to every investor. The S&P 500 Stock Index is a widely recognized capitalization-weighted index of 500 common stock prices in U.S. companies. The NYSE Arca Gold BUGS (Basket of Unhedged Gold Stocks) Index (HUI) is a modified equal dollar weighted index of companies involved in gold mining. The HUI Index was designed to provide significant exposure to near term movements in gold prices by including companies that do not hedge their gold production beyond 1.5 years. The MSCI Emerging Markets Index is a free float-adjusted market capitalization index that is designed to measure equity market performance in the global emerging markets. The U.S. Trade Weighted Dollar Index provides a general indication of the international value of the U.S. dollar.
Frank Holmes Archive |
© 2005-2022 http://www.MarketOracle.co.uk - The Market Oracle is a FREE Daily Financial Markets Analysis & Forecasting online publication.