


Gold and Silver Timing is Everything
Commodities / Gold and Silver 2014 Oct 22, 2014 - 05:45 PM GMTBy: Peter_Degraaf

 Timing is everything in investments, and after watching the precious metals markets for the past three months, since the publishing of his last article at the June lows, Peter draws the conclusion that gold bullion and gold mining stocks have finally bottomed and are ready to resume the bullish trend than began twelve years ago.
(Charts courtesy Stockcharts.com unless indicated).
The fundamentals support an end to the correction that began in September of 2011:
1. Asian and Russian banks continue to accumulate gold faster than mines can produce this precious metal.
2. Western nations are running ongoing Federal Deficits. Deficits are always covered with printing press money. This ‘currency destruction’ causes investors to add gold and silver to their net worth. (See data point from Mark J. Lundeen in this article.
3. There have been no new multi-million ounce gold discoveries for a number of years, thus mine supply is not increasing and may even decline.
4. New gold mines take ten years from the time gold is found until production can begin – due to the mountain of regulations that need to be dealt with.
5. The cost of building a new gold mine continues to rise, as building materials cost more over time, and the price of oil and gas to run the machinery is on the rise (short-term pullbacks in energy notwithstanding). This cost of production puts a floor under the gold price at around $1,200.00.
6. Central banks have stopped selling gold, and much of the gold that is supposedly held by these banks, has been leased out and was sold into the market. The 8,000 tonnes supposedly in the custody of the US government has not been audited since 1953. (Imagine a private company operating in this manner).
7. The US stock markets are showing signs of topping out. The money that will now be drawn out of the stock market has to go somewhere and preferably into a sector that is not overbought. Bonds are overbought and bubbling, real estate is not cheap, (except farmland), and this leaves gold and silver which have been oversold at the COMEX, by bullion banks that do not own the bullion to back up the contracts they have sold short. These banks will soon have to begin to cover their short positions, because of increasing demand for ‘the real thing’.
8. Bullion ETFs have coughed up many tonnes of physical gold since 2011, and much of the gold that is left on the shelf is owned by people who are not interested in selling at this historically low gold price, (see our first chart).
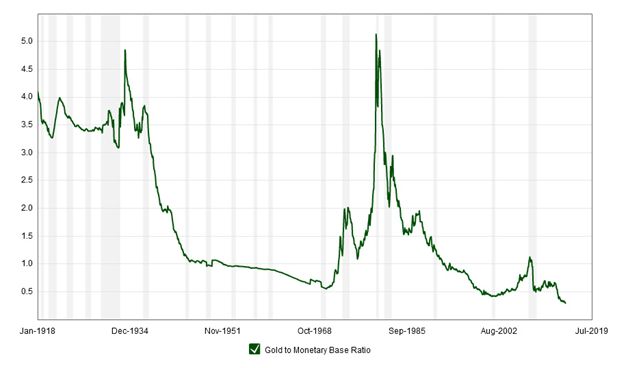
This Gold to Monetary Base Ratio Chart courtesy Macrotrends.net, shows the price of gold compared to the dollar total of the US Monetary Base. The Monetary Base consists of the number of dollars and dollar substitutes floating within the system. Historically, when this chart trades near the top, gold is overbought (notice the most recent top in 1980. When it trades near the bottom (notice the low level in 2002), gold is oversold. This chart shows gold to be the most oversold (read: ‘a bargain’), going back 100 years! Skeptics might say that gold could become even more oversold, and they may be right. But is that the way to bet? Alert investors will want to look for an upturn in this index. Simply add Macrotrends.net to your favorites and visit the site weekly.
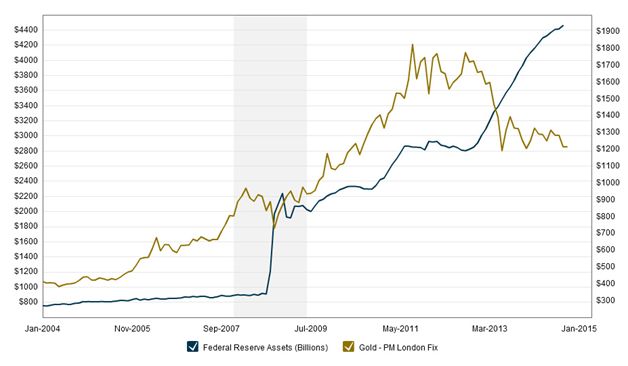
This chart is also courtesy Macrotrends.net and shows a large gap that has opened up between Federal Reserve Assets, (assets bought from banks within in the system at prices well above actual current market values), and the gold price. Historically, for the past ten years, whenever FED assets (blue line – values at left scale) rose, gold (with price at right side), soon followed. At the moment there is a wide gap opening up. Unless we expect the FED to be able to get rid of those assets (who would buy them?), the gold price is likely to begin closing this gap. Once the gap is closed, we may even see gold rise above FED Assets again, as happened from 2004 until 2012.
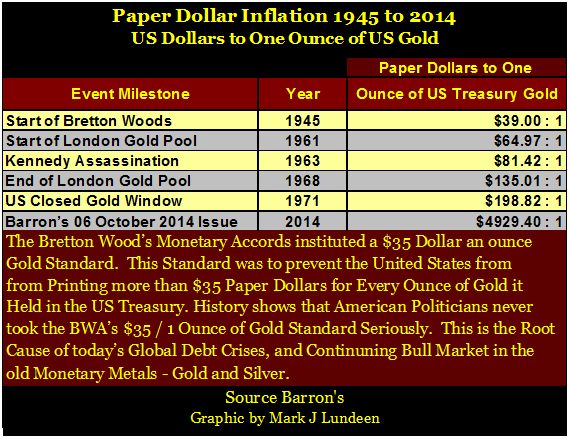
This data table courtesy Mark J. Lundeen shows the comparison between US dollars in circulation and the price of gold. Although this table is not intended to guarantee that gold will rise to $4929.00 per ounce, it does indicate that at $1,240.00 gold is a bargain!
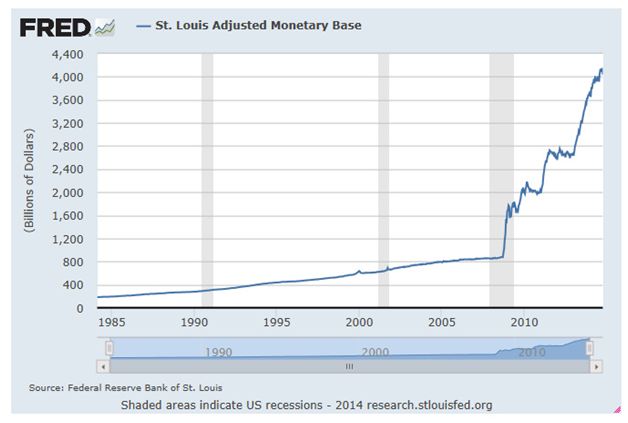
This chart courtesy Federal Reserve Bank of St. Louis shows the US Monetary Base continues to rise exponentially. No signs of tapering here.
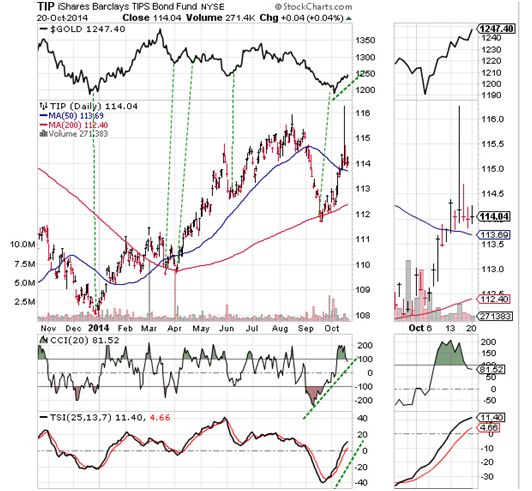
Featured is TIP the bond fund that is indexed for inflation, with gold at the top for comparison. Turns in TIP often coincide with turns in the price of gold. There are five in this chart (vertical green lines). The uptrend in TIP has been underway since January. This indicates an expectation on the part of TIP investors that they expect price inflation to continue. The current breakout at the 50DMA has bullish implications for gold.
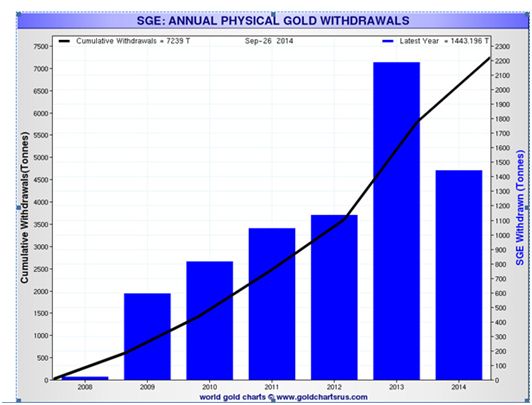
This chart courtesy Goldchartsrus.com shows the steady increase in physical gold withdrawals at the Shanghai Gold Exchange. This indicates ‘end usage’ of gold, such as investment demand or jewelry off-take, rather than the shuffling of paper claims for non-existent gold as at the COMEX, where there are 100 claims for every ounce of gold.
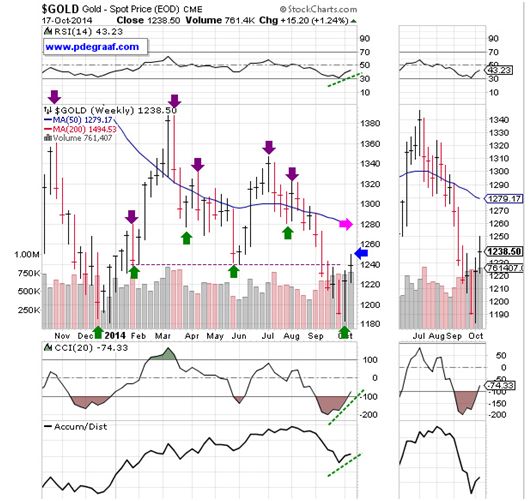
Featured is the weekly gold chart. The green arrows point to bottoms in the 7 - 8 week gold cycle, the purple arrows point to tops. The goal is to buy near the bottoms and take partial profits near the tops. This week is #2 in the current cycle. The supporting indicators are turning positive. The upside reversal of last week matches perfectly the upside reversal from December 2013. Monday’s closing price above $1240 is further proof that the bottom at $1180 is holding. The Gold Direction Indicator closed at 25% on Monday Oct 20th, up from 3% on Oct. 1st. This GDI reading is updated in all of our reports. Sample copy is available via our website.
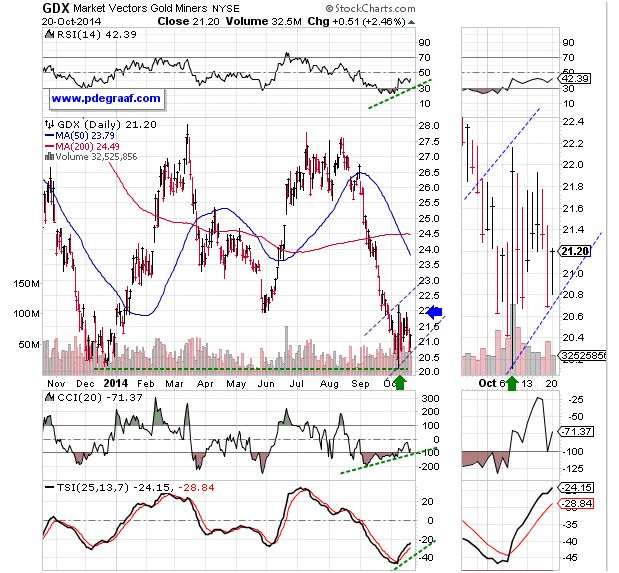
Featured is GDX the gold and silver miners ETF. Price produced an upside reversal a few days ago (green arrow), and is now benefiting from that energy. The supporting indicators are turning positive. A close above the blue arrow will confirm the double bottom at 20.0
In our widely acclaimed reports we feature a ‘long-term buy/sell signal’ for several dozen mining stocks. A number of these miners have recently turned bullish, and others are getting close. A sample copy may be requested via our website.
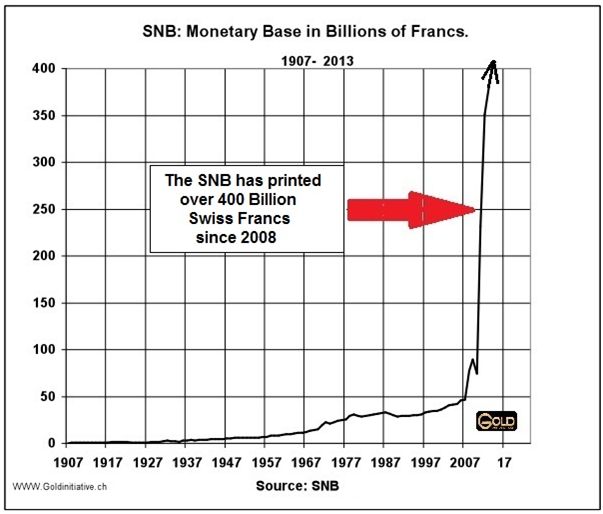
This chart courtesy Goldswitzerland.com shows the monetary inflation that the Swiss Central Bank has engaged in since 2008. On November 30th the citizens of Switzerland will be offered the opportunity to vote.
They will do this in a referendum on the “Gold Initiative” which has three demands:
1. 1. Returning the gold held abroad (in Canada and the UK) to Switzerland
2. 2. The Swiss National Bank must hold 20% of their assets in physical gold
3. 3. No further gold sales.
A ‘yes’ vote will be bullish for gold and could light a rocket under the gold price.
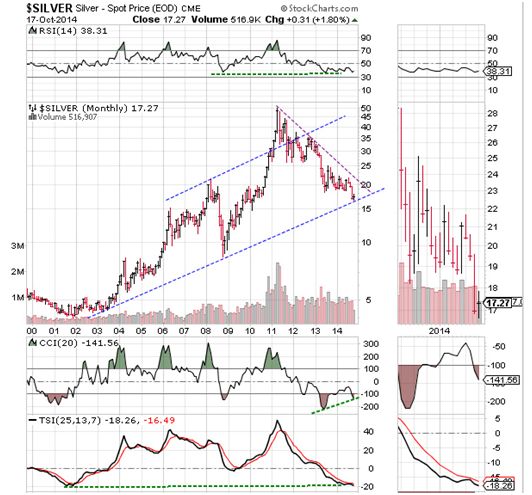
Featured is the monthly bar chart for silver in log format. The mini-version at the right shows recent detail. In the event that price closes above 17.00 by the end of this month, the result will be an upside reversal. This is a bullish pattern and it will convince many traders that price is turning up. All of the supporting indicators are at support levels. A breakout at the purple downtrend line will turn the silver price back to bullish.
NOTE: Please do your own due diligence. Peter Degraaf is not responsible for your trading decisions.
By Peter Degraaf
Peter Degraaf is an on-line stock trader with over 50 years of investing experience. He issues a weekend report on the markets for his many subscribers. For a sample issue send him an E-mail at itiswell@cogeco.net , or visit his website at www.pdegraaf.com where you will find many long-term charts, as well as an interesting collection of Worthwhile Quotes that make for fascinating reading.
© 2013 Copyright Peter Degraaf - All Rights Reserved
DISCLAIMER:Please do your own due diligence. Investing involves taking risks. I am not responsible for your investment decisions.
Peter Degraaf Archive |
© 2005-2022 http://www.MarketOracle.co.uk - The Market Oracle is a FREE Daily Financial Markets Analysis & Forecasting online publication.