


Anatomy of a Stock Market Sell-Off
Stock-Markets / Stock Markets 2014 Oct 18, 2014 - 05:30 PM GMTBy: Money_Morning

 Michael A. Robinson writes: Meet “Mr. Market.”
He’s the analogy that Warren Buffett – you know him – uses to help investors understand the market as though it were a person.
Usually, Mr. Market is as rational as the efficient market we all dream about.
But Mr. Market also suffers periods of manic depression.
In the space of just a few weeks, Mr. Market has gone from being downright giddy to sliding into a deep funk.
So, today I am going to lay out for you an anatomy of Mr. Market’s mood swings. That way you’ll understand what we are up against as investors and why I continue to say don’t cash out now…
See for Yourself
To understand what’s really happening with U.S. stocks, we need to perform some technical analysis. Think of this as the flip side of fundamentals – we’re examining charts, not financial statements.
We began a conversation about charting on Sept. 19. At the time, I introduced you to the concept of using simple moving averages to determine how much investor support a stock really has.
We can use these same tools to drill down and find out what’s happening in the market as a whole. We literally can see if we are in an uptrend or a downtrend, near a top or at a bottom.
In other words, technical analysis and charting can improve your timing so that you know when to put in less money and when to make bigger plays. And that’s what we are going to do now by charting key days in the market’s recent sell-off.
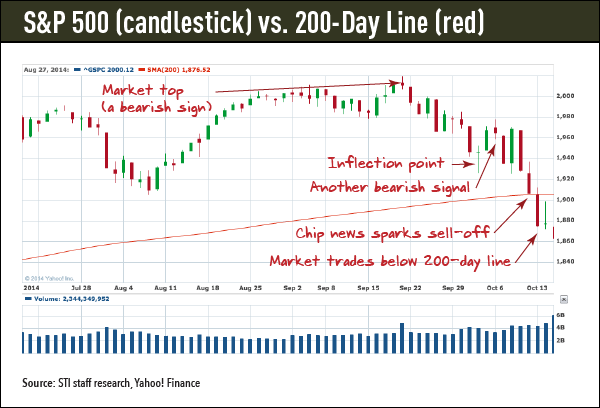
Today, I’m going to use the bellwether Standard & Poor’s 500 Index to depict the broad market. To see where we are in terms of investor support, we’re going to plot the 200-day moving average, which most pros consider the market’s crucial support level.
One more technical point: I’m going to be talking about candlestick patterns. These visual symbols really let you see what’s happening on any given day.
And they’re color coded – green for winning days, red for losing ones. So, let’s get started with our Anatomy of a Sell-Off by looking at key dates:
Sept. 19: Mr. Market Gets Manic
Take a look at the three-month chart and you’ll see that Sept. 19 marks the market’s recent high – and the day of the initial public offering for Alibaba Group Holding Ltd. (NYSE: BABA).
On the plus side, we moved farther from the 200-day line. But if you look closely, you’ll see what looks like a small shooting star for that day’s candlestick.
We could spend hours discussing the fine points of candlestick patterns. Instead, let’s cut to the chase. Even though the market closed at a high that day, the color and shape of the candlestick indicates a bearish end.
And there’s a good reason. Sept. 19 was the culmination of two days of negative news. On that day, investors learned that the dollar had hit a new high, threatening U.S. exports and growth. Also, the Ebola virus was in the news as causing a spike in cocoa prices, a troubling trend for inflation hawks.
On Sept. 19, it was as though Mr. Market partied too hard, realized he had too much to drink and went home to sleep it off. The big red candlestick the next day shows he treated his hangover by selling stocks.
Oct. 2: Mr. Market Turns Ambivalent
Sometimes Mr. Market just can’t make his mind. To see what I mean, take a look at the thin green cross for Oct. 2. The market went up, went down and ended the day almost dead even. The S&P opened that day at 1945.83 and closed at 1946.17, a difference of mere 0.017%.
And no wonder. That day The Wall Street Journal had a story about how leading economic experts were undecided as to whether the U.S. or European central banks were taking the right courses of action for stimulating growth. If these experts can’t figure it out, how can Mr. Market?
The thinness of the green candlestick cross (called a doji) indicates the market is at an inflection point. It could have gone either way. In a case like this, we had to wait a few days for confirmation of the trend.
Oct. 6: Mr. Market Gets Depressed
Sure enough, we got the downtrend signal just four days later. On Oct. 6 we see a bearish candlestick pattern known as a shooting star. It’s shown as a red body with a thin tail.
Turns out, there’s a good reason’s for Mr. Market anxiety. That day we got word that German factories had a big decline in orders. Because Germany is Europe‘s key economy, many investors saw that as confirmation of slowing global growth.
Let’s not forget that this occurred amid more worries about Ebola and the protests in Hong Kong. And Mr. Market was already anxious about what the U.S. Federal Reserve‘s reduced bond buying might mean for the economy and corporate profits.
Oct. 10: Mr. Market Meets His Enabler
Sometimes Mr. Market finds someone who confirms his worst fears. Enter Steve Sanghi, who helped convince Mr. Market to sell, sell, sell. Sanghi is the CEO of Microchip Technology Inc. (Nasdaq: MCHP).
The veteran tech leader scared investors by saying he believes the semiconductor sector has entered a correction. Because just about everything relies on chips, investors hit the panic button.
No matter that other chip firms had recently raised guidance; Mr. Market and Sanghi became fast friends. They formed their bond the day after the Fed warned that global growth was slowing and a Dallas man with Ebola was reported to have died.
This time Mr. Market really freaked out, pushing the S&P to the 200-day moving average for the first time in two years. You see that in the chart where the big red candlestick is sitting on the 200-day line. The market fell below that support level the next Monday, Oct. 13.
Where does all this leave us now? After carefully studying the charts, I believe stocks are substantially oversold. The last time the S&P fell below the 200-day moving average, in November 2012, a rally soon followed.
Since then, despite the volatility and recent sell-off, the S&P is up more than 35%. That’s one of the reasons why I told you on Wednesday that you should always have some money in the market.
Otherwise, you’ll miss the rebound. In fact, I’m starting to compile a shopping list of beaten-down tech stocks I would love to buy from Mr. Market at huge discounts.
I plan to share that list with you in an upcoming column. Until then, try to stay relaxed and focused.
That’s how we turn the tables on Mr. Market: We buy his fear and sell his greed.
Source : http://strategictechinvestor.com/2014/10/anatomy-sell/
Money Morning/The Money Map Report
©2014 Monument Street Publishing. All Rights Reserved. Protected by copyright laws of the United States and international treaties. Any reproduction, copying, or redistribution (electronic or otherwise, including on the world wide web), of content from this website, in whole or in part, is strictly prohibited without the express written permission of Monument Street Publishing. 105 West Monument Street, Baltimore MD 21201, Email: customerservice@moneymorning.com
Disclaimer: Nothing published by Money Morning should be considered personalized investment advice. Although our employees may answer your general customer service questions, they are not licensed under securities laws to address your particular investment situation. No communication by our employees to you should be deemed as personalized investent advice. We expressly forbid our writers from having a financial interest in any security recommended to our readers. All of our employees and agents must wait 24 hours after on-line publication, or after the mailing of printed-only publication prior to following an initial recommendation. Any investments recommended by Money Morning should be made only after consulting with your investment advisor and only after reviewing the prospectus or financial statements of the company.
Money Morning Archive |
© 2005-2022 http://www.MarketOracle.co.uk - The Market Oracle is a FREE Daily Financial Markets Analysis & Forecasting online publication.