


Stock Market VIX Voodoo Analysis
Stock-Markets / Volatility Oct 06, 2014 - 12:59 PM GMTBy: Austin_Galt

 The Volatility Index (VIX) seems to be indicating something big is brewing. Let's investigate taking a bottom up approach beginning with the daily chart.
VIX Daily Chart
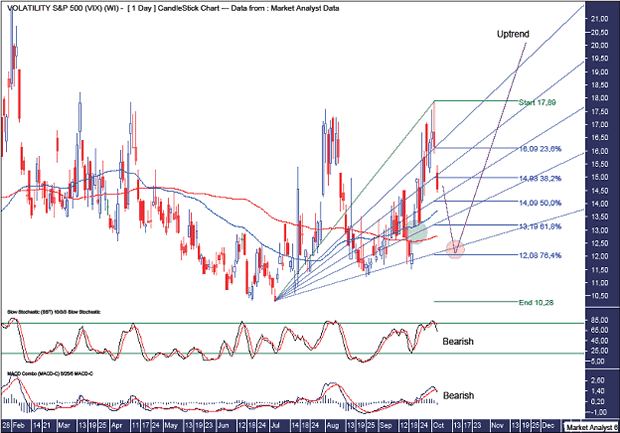
Since the low back in July 2014, price has developed a pattern of higher highs and higher lows - a bull trend. The Stochastic and Moving Average Convergence Divergence (MACD) indicators have just turned bearish so perhaps price is now headed down to put in yet another higher low. Where is this next low likely to be?
I have drawn a green highlighted circle which shows a gap. The high of the gap is 13.13 while the low of the gap is 12.61. I expect this gap to be filled before any continuation of the uptrend.
I have added a Fibonacci Fan from the low to recent high. Price looks to show some nice symmetry with this fan. Looking retroactively we can see price has found support a couple of times at the 76.4% angle. Perhaps price is headed back down for another test of the angle support.
I have added Fibonacci retracement levels of the move from low to recent high. The 76.4% fan angle is just above the 76.4 retracement level at 12.08. This is where I'm looking for price to make its higher low and can be seen in the orange highlighted circle.
VIX Weekly Chart
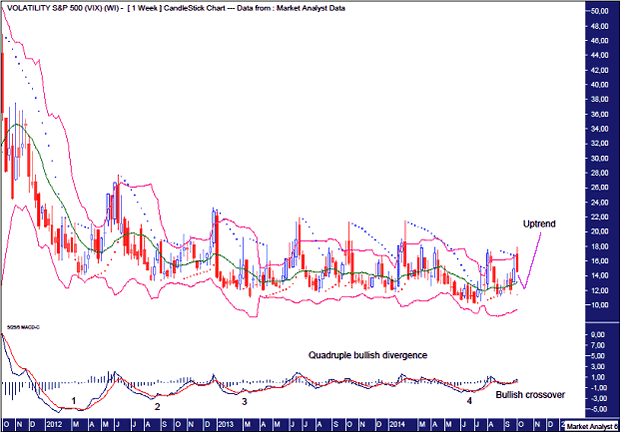
The Bollinger Bands show price bobbing up and down between the upper and middle bands over the last couple of months. Price looks headed back down now and perhaps the middle band will provide support once again. Let's see.
The Parabolic Stop and Reverse (PSAR) indicator shows a bullish bias after price busted the dots to the upside last week. These dots will be support for any move down now and if this support holds then it can act as a springboard for price to surge higher. The dots are just below the previous low of 11.52.
The MACD indicator shows a recent bullish crossover and this is coming on top of a quadruple bullish divergence. Something big looks set to take place here shortly.
VIX Monthly Chart
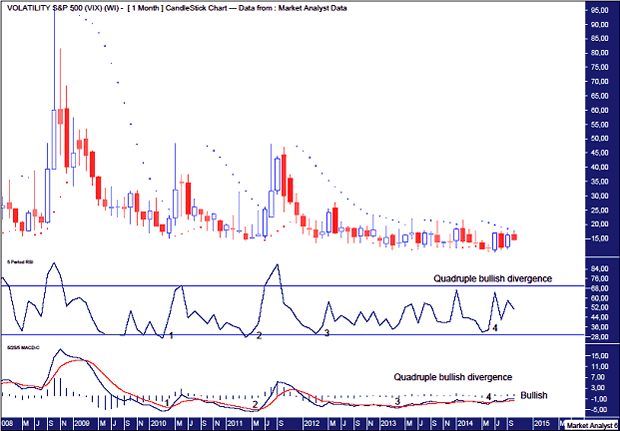
If a quadruple bullish divergence on the weekly chart wasn't enough, how about on the monthly chart?! Both the Relative Strength Indicator (RSI) and MACD indicator are showing quadruple bearish divergences. The MACD is also bullish so conditions are certainly ripe for an explosion higher.
The PSAR resistance held price in its attempt already this month to crack higher. Price looks headed down now but perhaps if price can turn back up this month it will be successful on its second attempt.
As for where price may come back to, I favour price consolidating the September candle. The open price for September was 12.32 and I suspect price can trade back to that level.
Let's now zoom out for some big picture perspective with the yearly chart.
VIX Yearly Chart
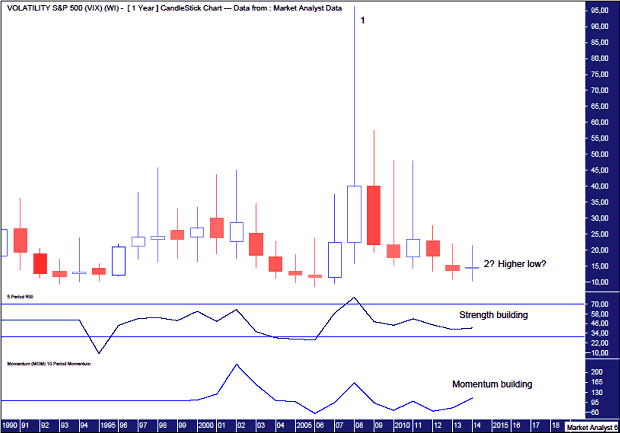
I have added some simple Elliott Wave annotations which show the spike high in 2008 as the end of wave 1. That seems hard to believe but taking out the emotion that was the first major top after the all time low.
Price now looks like it is setting up a higher low which would be the end of wave 2. That implies wave 3 has already begun which should see price explode higher above the all time high of 96.40. I know this seems far-fetched but could it really be possible?
The RSI looks to be building strength with a pattern of higher highs and higher lows.
Momentum also appears to be building and it will be interesting to see if it takes out its own 2008 high. One possibility is price makes a new high while momentum does not. Time will tell.
This VIX analysis suggests something terrible and devastating is likely to happen to the stock market. Bears would be licking their lips.
Let's quickly look at the yearly chart of the Dow to see if this VIX analysis fits with its long term picture.
Dow Yearly Chart
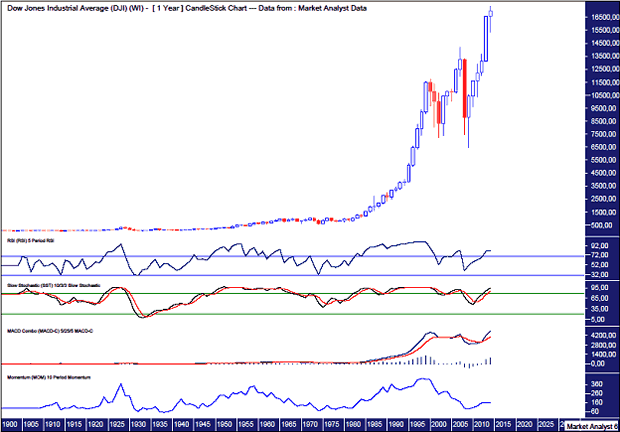
This yearly chart begins in 1900.
The RSI looks set to show a triple bearish divergence on this top.
The Stochastic indicator looks like it is having one last hurrah in overbought territory.
The MACD indicator shows the averages have diverged wildly which looks in need of some "regression to the mean".
Momentum looks to have fallen off a cliff.
Hmmm. I don't really think I need to comment further.
By Austin Galt
Austin Galt is The Voodoo Analyst. I have studied charts for over 20 years and am currently a private trader. Several years ago I worked as a licensed advisor with a well known Australian stock broker. While there was an abundance of fundamental analysts, there seemed to be a dearth of technical analysts. My aim here is to provide my view of technical analysis that is both intriguing and misunderstood by many. I like to refer to it as the black magic of stock market analysis.
© 2014 Copyright The Voodoo Analyst - All Rights Reserved
Disclaimer: The above is a matter of opinion provided for general information purposes only and is not intended as investment advice. Information and analysis above are derived from sources and utilising methods believed to be reliable, but we cannot accept responsibility for any losses you may incur as a result of this analysis. Individuals should consult with their personal financial advisors.
© 2005-2022 http://www.MarketOracle.co.uk - The Market Oracle is a FREE Daily Financial Markets Analysis & Forecasting online publication.