


The World's 10 Biggest Energy Gluttons
Commodities / Energy Resources Oct 02, 2014 - 12:05 PM GMTBy: OilPrice_Com

 Next time you get into your car and drive to the supermarket, think about how much energy you consume on an annual basis. It is widely assumed that Westerners are some of the world's worst energy pigs. While Americans make up just 5 percent of the global population, they use 20 percent of its energy, eat 15 percent of its meat, and produce 40 percent of the earth's garbage.
Europeans and people in the Middle East, it turns out, aren't winning any awards for energy conservation, either.
Oilprice.com set out to discover which countries use the most energy and why.
While some of the guilty parties are obvious, others may surprise you. A note about the figures: we used kilograms of oil equivalent (koe) per capita, which refers to the amount of energy that can be extracted from one kilogram of crude oil. "Koe per capita" can be used to compare energy from different sources, including fossil fuels and renewables, and does here. The numbers represent the most recent data available from the World Bank.
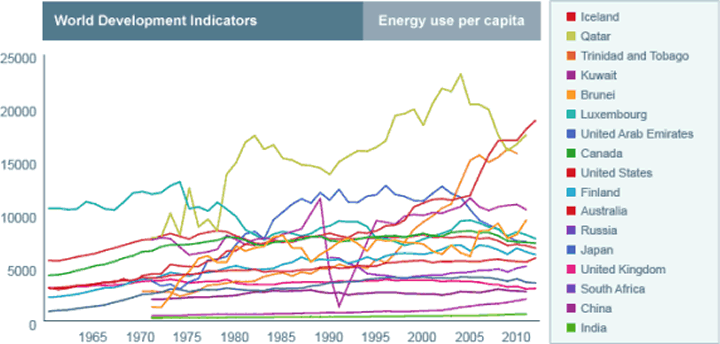
Image Source: Oilprice.com
Iceland - 18,774 kg. Yes, that's right, Iceland. Of all the countries in the world, including the richest and largest oil producers, Iceland consumes the most energy per person. How can that be? The reason is basically overabundance. With most of Iceland's energy coming from hydroelectric and geothermal power, Icelanders are some of the planet's least energy-conscious. Click here for a fascinating video of why the Nordic nation uses so much energy.
Qatar - 17,418 kg. Qataris are addicted to oil. According to National Geographic, the population is provided with free electricity and water, which has been described as "liquid electricity" because it is often produced through desalination, a very energy-intensive process. Qatar's per capita emissions are the highest in the world, and three times that of the United States.
Trinidad and Tobago - 15,691 kg. Trinidad and Tobago is one of the richest countries in the Caribbean, and the region's leading producer of oil and gas; it houses one of the largest natural gas processing facilities in the Western Hemisphere. T&T is the largest LNG exporter to the United States. Its electricity sector is entirely fueled by natural gas.
Kuwait - 10,408 kg. Despite holding the sixth-largest oil reserves in the world, and an estimated 63 trillion cubic feet of natural gas reserves, the demand for electricity in Kuwait often outstrips supply. According to the U.S. Energy Information Administration (EIA), Kuwait is perpetually in electricity supply shortage and experiences frequent blackouts each summer. The country has become a net importer of natural gas to address the imbalance.
Brunei - 9,427 kg. The tiny sultanate on the island of Borneo, apart from being a substantial producer and exporter of oil and natural gas to Asia, is also a habitual power hog. The nation of roughly half a million has the region's highest number of cars per capita. Brunei also subsidizes both vehicle fuel and electricity, which is sold to the public at below-market prices.
Luxembourg - 7,684 kg. Landlocked Luxembourg is almost totally dependent on energy imports, mostly oil and gas. Energy consumption has increased 32 percent since 1990, with transportation responsible for 60 percent of the intake, according to an EU fact sheet.
United Arab Emirates - 7,407 kg. Nothing says conspicuous energy consumption like Ski Dubai. The indoor resort featuring an 85-meter-high mountain of man-made snow burns the equivalent of 3,500 barrels of oil a day. The World Resource Institute estimates the UAE uses 481 tonnes of oil equivalent to produce $1 million of GDP, compared to Norway's 172 tonnes.
Canada - 7,333 kg. Oh, Canada. Kind, peace-loving Canadians certainly love their cars, along with space heaters, hot tubs and other energy-sucking toys. But while many equate Canada's energy sector with the oil sands, it is, in fact, other forms of energy that account for the lion's share of consumption. EcoSpark published a pie chart showing over half (57.6 percent) of Canada's electricity comes from hydro, with coal the second most popular choice at 18 percent. Nuclear is third (14.6 percent), with oil and gas comprising just 6.3 percent and 1.5 percent, respectively.
United States - 6,793 kg. As the world's largest economy and richest nation, the U.S. should obviously be included as a top 10 energy glutton. However, one puzzling fact is that despite annual economic growth, per-capita U.S. energy consumption has remained around the same level since the 1970s. According to the EIA, one explanation is that the U.S. has simply shifted the energy required to satisfy greater consumption to manufacturing centers offshore.
Finland - 6,183 kg. With over a third of its territory above the Arctic Circle, a cold climate, sparse population and a highly industrialized economy, it is no wonder that Finland is among the highest per-capita energy users in Europe. However, according to the International Energy Agency, Finland plans to diversify its economy away from carbon-based fuels, through a shift to renewables, including biomass, and has approved construction of two new nuclear plants.
Source: http://oilprice.com/Energy/Energy-General/The-Worlds-10-Biggest-Energy-Gluttons.html
By Andrew Topf of Oilprice.com
© 2014 Copyright OilPrice.com- All Rights Reserved
Disclaimer: The above is a matter of opinion provided for general information purposes only and is not intended as investment advice. Information and analysis above are derived from sources and utilising methods believed to be reliable, but we cannot accept responsibility for any losses you may incur as a result of this analysis. Individuals should consult with their personal financial advisors.
© 2005-2022 http://www.MarketOracle.co.uk - The Market Oracle is a FREE Daily Financial Markets Analysis & Forecasting online publication.