


Stock Market Primary IV Underway?
Stock-Markets / Stock Markets 2014 Sep 27, 2014 - 04:28 PM GMTBy: Tony_Caldaro

 After establishing an all time high on OPEX Friday a week ago the market went into volatility mode this week. Every day we observed the DOW moving triple digits: three down and two up. For the week the SPX/DOW were -1.2%, the NDX/NAZ were -1.3%, and the DJ World index lost 2.0%. Economic reports for the week were skewed to the downside. On the uptick: the FHFA, new home sales and Q2 GDP. On the downtick: existing home sales, durable goods, the WLEI and weekly jobless claims rose. Next week, end of month/quarter, will be highlighted by Friday’s Payrolls report and the PCE and ISM during the week.
LONG TERM: bull market
The Cycle wave bull market from the March 2009 continues to unfold in five Primary waves. Primary waves I and II completed in 2011, and Primary III has been underway since that October 2011 low. Primary I divided into five Major waves with a subdividing wave 1, and simple waves 3 and 5. Primary III has also divided into five Major waves, but wave 1 was simple and waves 3 and 5 have subdivided.
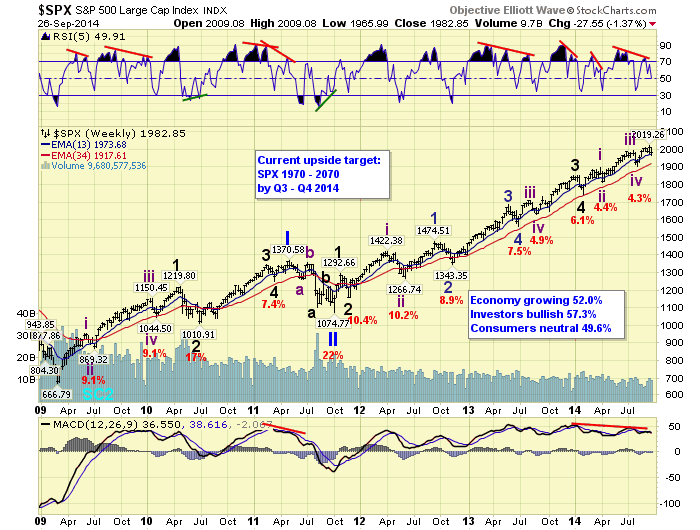
After the Primary I high in May 2011 the market declined for five months and lost 23% of its value during Primary II. So it is important to identify the Primary III high as we are likely to experience a similar type of correction for Primary IV. We estimate it will last about three months and the market should lose between 15% and 20% of its value.
During Primary III Major waves 1 and 2 completed in late 2011. Major waves 3 and 4 completed in early 2014. A subdividing Major wave 5 has been underway since that February 2014 low. The SPX count suggests the market is currently in an Intermediate wave v uptrend. When it concludes, if it hasn’t already, Primary IV should be underway.
MEDIUM TERM: uptrend in jeopardy
The current uptrend started in late august at SPX 1905. We count five waves up into the recent SPX 2011 high. Then the market pulled back to SPX 1979 just before it rallied in three days to the 2019 pivot. After that, which was last Friday, we had a very volatile week. Initially we thought the pullback to SPX 1979 ended Minor wave 2 and Minor 3 was underway to new highs. When the market dropped back to SPX 1979, rallied to 2000, and then dropped to 1966 we realized something bigger than just a pullback might be underway. So we set some parameters and dug a little deeper into some historical charts.
For the past month or so we had been considering an extending Major wave 5. This would require a few more uptrends to complete. The basis for this reasoning was the shallow Major wave 4 correction in the NDX/NAZ, the odd pattern in the DOW since the beginning of the year, and the ECB initiating their form of QE. Over the past week or so two of these potential positives appear to have diminished.
The ECB is counting on their TLTRO programs 1 thru 8 to generate most of the $700bn increase in their balance sheet. TLTRO 1 was a small $86bn, and the other programs are not until December. Their ABS program, according to the vice president of the ECB, is not expected to amount to much. We originally thought it would be the biggest part! The recent small Major 4 correction in the NDX/NAZ is not as big a factor as we originally thought. We knew that second and fourth waves, during a bull market, are usually quite similar. But the second and fourth waves of this bull market are Primary waves, not the Major waves during a rising Primary wave. We will continue to carry the extending wave alternate count on the DOW charts, but no longer consider it a high probability. Certainly not 50/50 against the current SPX count.
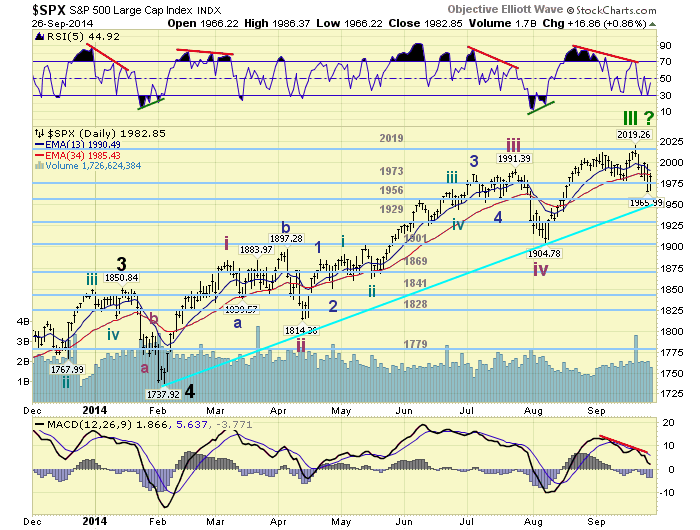
The main question, due to all the recent volatility, is did the uptrend end at SPX 2019. The uptrend on the daily charts does look like three waves up to SPX 2019: 2011-1979-2019. But some are counting it as a five wave pattern. If one looks closely at the last uptrend of Primary I, it also looked like three waves up when it topped. But it was clearly a five as that was the top of Primary I. Are we again seeing a similar pattern to end Primary wave III?
A review of the charts displays many negatives. The monthly RSI has a negative divergence and the MACD is sky high. The weekly and daily charts both have negative divergences on the RSI and MACD. The NYAD is close to confirming a downtrend, suggesting the advances are getting narrower and narrower. The R2K has already confirmed another downtrend after peaking during the SPX Intermediate wave iii in July. And now, the recent volatility is looking similar to the early stages of Primary wave II. In 2011 the market gyrated wildly too: -42 +30, -40 +28, -35 +33, then down 79 and so forth. From the SPX 2019 high so far: -40 +21, -34 +20 as of Friday. This is starting to look similar.
We noted during the week, after the market pulled back to SPX 1979 and rallied to 2000 the following. Should the SPX drop down to 1979 again and break the 1973 pivot range the probabilities would increase that a downtrend, and Primary IV are underway. Later we added should the SPX break the 1956 pivot and confirm a downtrend the evidence would be most conclusive. On Thursday the SPX traded below 1979, and closed at the lowest end of the 1973 pivot range (1966). Then Friday the market gapped up avoiding a break of the 1973 pivot. Nevertheless, we have seen enough to raise the probability of a Primary wave IV underway to 60/40. Medium term support is at the 1973 and 1956 pivots, with resistance at the 2019 and 2070 pivots.
SHORT TERM
As noted above we have an odd configuration from the SPX 1905 low that could be counted as three waves to SPX 2019, or five waves. The activity since that high is clearly corrective: SPX 1979-2000-1966-1986. The bulls could count the SPX 1966 low as the end of Minor wave 2, with Minor wave 3 underway. The bears can count the SPX 1966 low as the end of Minor wave A, with Minor B underway. The bulls need a rally above SPX 2019 to confirm their Minor 3 scenario is underway. The bears need a decline below SPX 1966 to confirm their Primary IV scenario is underway. Bullish and bearish these are our two parameters: SPX 1966 and SPX 2019.
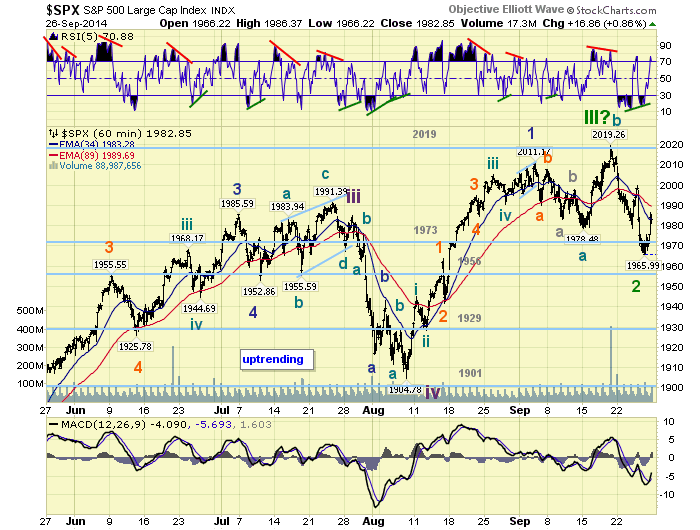
We had also noted above four parameters: SPX 1979, the 1973 pivot, the 1956 pivot, and confirming a downtrend. At this stage of the wave pattern, a break of the 1973 pivot heading towards the 1956 pivot will likely be enough to confirm a downtrend. With the market closing at SPX 1983 on Friday, this is less than a 2% decline. Clearly the current pattern, technical indicators, and some specific indices favor the bearish scenario. And, a downtrend confirmation will probably confirm Primary IV is underway. Short term support is at the 1973 and 1956 pivots, with resistance at SPX 2000 and the 2019 pivot. Short term momentum ended the week overbought.
FOREIGN MARKETS
The Asian markets were nearly all lower losing a net 1.2% on the week.
The European markets were all lower losing 2.2% on the week.
The Commodity equity group were all lower losing 1.2% on the week.
The DJ World index lost 2.0% on the week.
COMMODITIES
Bonds continue to downtrend but gained 0.3% on the week.
Crude remains in a downtrend but gained 1.7% on the week.
Gold is also downtrending but gained 0.3% on the week.
The USD remains in an uptrend gaining 1.1% on the week.
NEXT WEEK
Monday: Personal income/spending, and the PCE at 8:30, then Pending home sales at 10am. Tuesday: Case-Shiller, Consumer confidence, the Chicago PMI, and a speech from FED governor Powell. Wednesday: the ADP, ISM manufacturing, Construction spending and Auto sales. Thursday: weekly Jobless claims and Factory orders. Friday: Payrolls (est. +228K), the Trade deficit and ISM services. Best to your weekend and week!
CHARTS: http://stockcharts.com/public/1269446/tenpp
http://caldaroew.spaces.live.com
After about 40 years of investing in the markets one learns that the markets are constantly changing, not only in price, but in what drives the markets. In the 1960s, the Nifty Fifty were the leaders of the stock market. In the 1970s, stock selection using Technical Analysis was important, as the market stayed with a trading range for the entire decade. In the 1980s, the market finally broke out of it doldrums, as the DOW broke through 1100 in 1982, and launched the greatest bull market on record.
Sharing is an important aspect of a life. Over 100 people have joined our group, from all walks of life, covering twenty three countries across the globe. It's been the most fun I have ever had in the market. Sharing uncommon knowledge, with investors. In hope of aiding them in finding their financial independence.
Copyright © 2014 Tony Caldaro - All Rights Reserved Disclaimer: The above is a matter of opinion provided for general information purposes only and is not intended as investment advice. Information and analysis above are derived from sources and utilising methods believed to be reliable, but we cannot accept responsibility for any losses you may incur as a result of this analysis. Individuals should consult with their personal financial advisors.
Tony Caldaro Archive |
© 2005-2022 http://www.MarketOracle.co.uk - The Market Oracle is a FREE Daily Financial Markets Analysis & Forecasting online publication.