Analysis And Price Projection Of The Uranium Market
Commodities / Uranium Sep 15, 2014 - 11:34 AM GMTBy: Submissions
 Dr. Volkmar Hable writes: I travel a lot for the purpose of identifying new investment opportunities. In that process earlier this year I was offered by the governments of two countries Uranium exploration concessions of outstanding quality and location, and was told that no one would be interested in Uranium in these days. This caught my attention and we started to investigate. And sure enough, as a matter of fact, in these days it seems to be extremely easy to pick up Uranium concessions anywhere between Greenland and South-Africa.

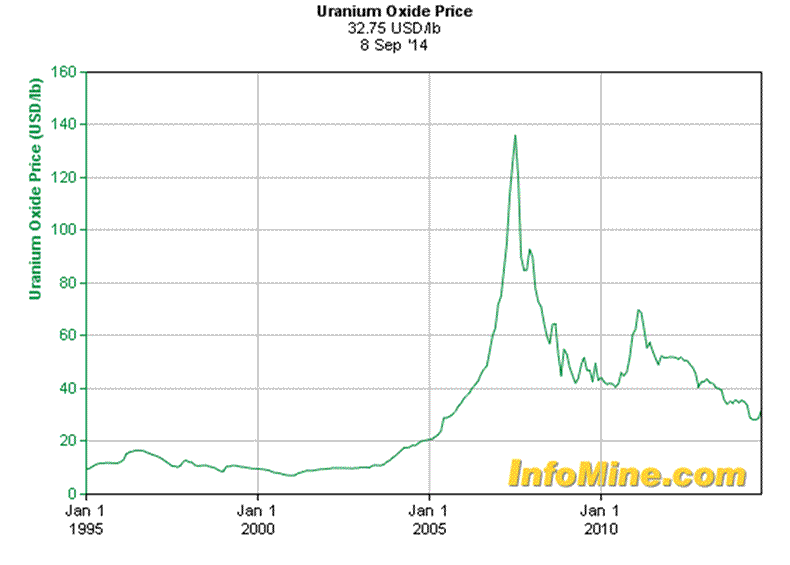
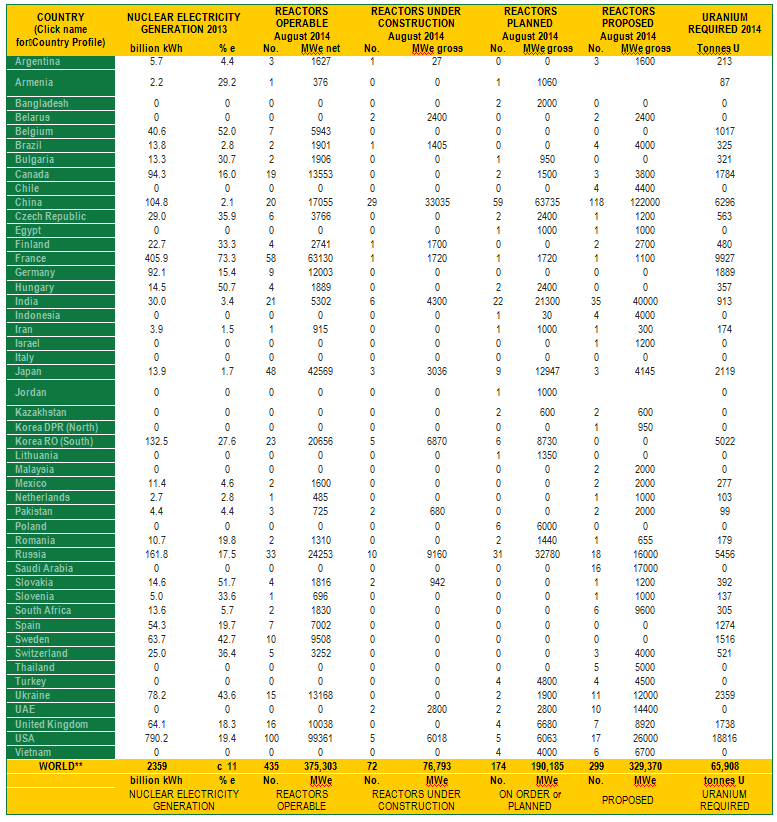
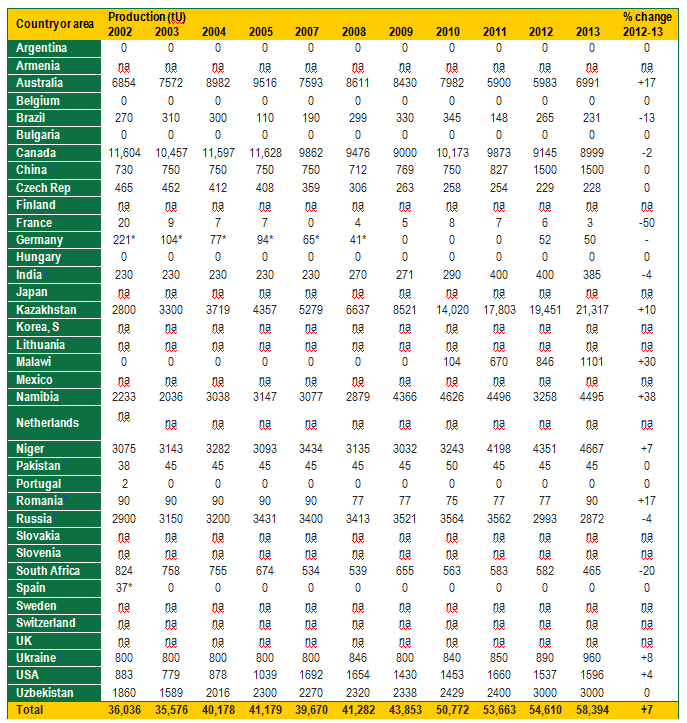
The exceptional price decay in Uranium in the past 10 years seems to offer a reasonable explanation. Many Uranium deposits require a minimum price of 45 to 50 USD per pound in order to only operate at breakeven. The current and past price levels simply don’t accommodate the development or exploration of Uranium rich areas. Low prices are usually caused by low demand. And here is the Uranium “conundrum”, supported by detailed figures (Source: courtesy of the World Nuclear Council). As readers can easily see, by checking the bottom lines of the respective tables, there has been consistently a significant gap between production and a much higher demand. In 2013 production from world Uranium mines supplied about 85% of the requirements of power utilities. This gap so far has been bridged by supply of military Uranium and Plutonium resources, I’ll come to that in a minute.
All mineral commodity markets tend to be cyclical, for example, prices rise and fall substantially over the years. In the Uranium market, however, high prices in the late 1970s gave way to depressed prices in the whole of the period of the 1980s and 1990s, with spot prices below the cost of production for all but the lowest cost mines. In 1996 Uranium spot prices recovered to price levels where many mines could produce above breakeven, but a decline followed again and prices only started to recover strongly from 2003 onward. However, readers should keep in mind that the quoted spot prices apply only to trading and always have represented less than 18% of the entire supply. Most trade is via 5-15 year term contracts with producers selling directly to utility companies.
The reasons for fluctuation in mineral prices relate to demand and perceptions of scarcity. The price cannot indefinitely stay below the cost of production (see below), nor will it remain at very high levels for longer than it takes for new producers to enter the market and anxiety about supply to subside.
CIVIL NUCLEAR ENERGY PRODUCTION AND REQUIRED URANIUM

PRODUCTION OF URANIUM

DEMAND
About 445 reactors worldwide with combined capacity of over 376 GWe, require some 78,000 tonnes of Uranium oxide concentrate containing 66,000 tonnes of Uranium from mines (or the equivalent from stockpiles or secondary sources) each year.
This includes initial Uranium for new reactors coming online (thus the difference to the table above, which does not include this additional demand for new reactors).
The demand is growing steadily, and at the same time the reactors are being run more productively, with higher capacity factors.
Each GWe of increased new capacity will require about 155 tU/yr of extra mine production routinely, and about 300-450 tU for the first fuel load on start up of the new reactor.
The nuclear fuel consumption is measured in MW days per tonne U, and many utilities are increasing the initial enrichment of their fuel (eg from 3.3 towards 5.0% U235) and then burning it longer or harder to leave only 0.5% U-235 in it (instead of twice this).
Due to the cost structure of nuclear power generation, with high capital and low fuel costs, and the long planning periods, the demand for Uranium fuel is much more predictable than with any other mineral commodity. Once reactors are built, it is very cost-effective to keep them running at high capacity and for utilities to make any adjustments to load trends. Demand forecasts for Uranium therefore depend for the overwhelming part on installed and operable capacity, regardless of economic fluctuations. And it is this point exactly that would make Uranium mining an attractive stable long-term business proposition.
Looking 20 years ahead, the market is expected to grow significantly. The WNA 2013 Global Nuclear Fuel Market Report reference scenario (post Fukushima accident) shows a 49% increase in Uranium demand until 2024 , assuming a 36% increase in reactor capacity.
Electricity demand by 2030 is expected (by the OECD's International Energy Agency, 2008) to double from that of 2004, and it is hard to see how in a world concerned with limiting carbon emissions, and very much limited fossil fuel supplies, this additional demand can be supplied other than by nuclear power generation.
SUPPLY
In 2012 mines supplied some 58,344 tU, about 84% of utilities' annual requirements. The balance has been covered by secondary sources including military supplied and stockpiled Uranium held by utilities. Stockpiles of Uranium at the end of 2013 they were estimated to be at 90,000 tU in Europe and USA, and a bit less in East-Asia. Basically we are looking at stockpiles of a 1.5 to 2 years of annual consumption at current burn rates, which is not too bad.
The perception of imminent scarcity drove the pot price to over USD 130 in 2007 but since then has return back to above the 30 USD level, which is well below the breakeven cost of many mines.
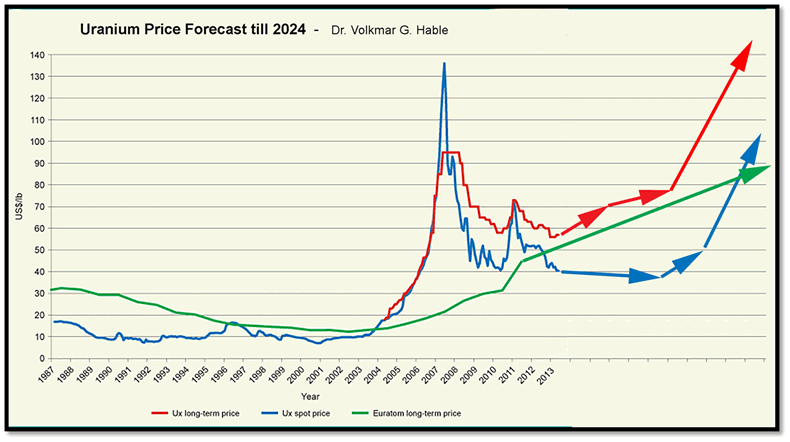
However, the long-term contracts are a different story, and there the prices are well above the spot price. Most long-term contracts and the prices in new contracts have, in the past, reflected a premium of at least 15 to 20 USD above the spot market, and in some cases even higher.
This divergence clearly is unsustainable and most certainly point to higher prices going forward, even without the prospect of an increase in electricity consumption.
The main growth in Uranium demand takes place today in India, Russia and China, and their vertically-integrated sovereign nuclear industries have sought equity in Uranium mines abroad, bypassing the market to a large degree 8which explains the low spot price despite high demand).
Strategic investment in Uranium production is a priority for these sovereign industries.
An important source of nuclear fuel is ex-military weapons-grade plutonium, as MOX fuel. Commitments by the USA and Russia to convert nuclear weapons into fuel for electricity production is known as the Megatons to Megawatts program.
Weapons-grade Uranium and plutonium surplus to military requirements in the USA and Russia is being made available for use as civil fuel. Weapons-grade Uranium is highly enriched, to over 90% U235 (the fissile isotope). Weapons-grade plutonium has over 93% Pu-239 and can be used, like reactor-grade plutonium, in fuel for electricity production. Highly-enriched Uranium from weapons stockpiles has been displacing some 8850 tonnes of U3O8 production from mines each year, and met about 13% to 19% of world reactor requirements through to 2013. It is unclear at this point how much longer the military is willing or able to supply fissile material to cover the short-falls of mine production. There was talk already in 2012 that in 2013 Russia would stop all sales for concerns about keeping enough for its army.
The demand side finishes the bullish picture for Uranium. The main catalyst is the move to green energy. Nuclear power plants have no carbon emissions. The growth of nuclear power is just beginning, but planned production is expected to greatly increase the demand for Uranium.
Westinghouse Electric signed a deal to build four nuclear reactors in eastern China. The price tag on the deal is $8 billion. This is just one tiny piece of the puzzle. China plans to spend approximately $50 billion to build 30 nuclear reactors by 2020. This will increase its nuclear energy production by 40 gigawatts. That’s basically enough power to supply all of Spain with electricity. The growth in the nuclear market has resulted in a very large increase in the demand for Uranium
The production of these mines takes time and money. Even if everything goes well, we are talking about at least six years until a mine becomes operational from initial exploration, and it’s for this reason that there is a long period of time during which demand exceeds supply. This shortage will always show up in price, and that’s exactly what we have and will continue to see.
PRICE PROJECTTION FOR URANIUM TILL 2024
Based on the above figures I expect a widening gap between supply and demand, which may be covered in part by increased efficiencies of new nuclear reactor plants, which will be exacerbated by the decrease in military supplies to the civilian market, and a s result should cause rising prices in both long-term contracts and spot prices. I expect prices to continue their sideways pattern for some more time. But as the transfer of military supplies to civil use is being reduced and more reactors are coming online we have reason to assume prices beyond the 100 USD mark in the next 5-7 years or so.

About the author:
Dr. Volkmar Hable is a geologist and physicist by training, he holds a Ph.D. in geosciences and a B.Sc. in Agriculture and Agronomics among other, and is fluent in English, French, Spanish, and German. He was CEO CEN-European operations of Fortune 500 company Adecco, manager of a Swiss hedge fund for 7 years and has spent a year in the Diplomatic Corps. He currently is a member of the in British-Columbia accredited Consular Corps, a director and fund advisor of Samarium Investment Corporation and CEO of Samarium Borealis Corporation.
© 2014 Copyright Dr. Volkmar Hable - All Rights Reserved
Disclaimer: The above is a matter of opinion provided for general information purposes only and is not intended as investment advice. Information and analysis above are derived from sources and utilising methods believed to be reliable, but we cannot accept responsibility for any losses you may incur as a result of this analysis. Individuals should consult with their personal financial advisors.
© 2005-2022 http://www.MarketOracle.co.uk - The Market Oracle is a FREE Daily Financial Markets Analysis & Forecasting online publication.


