


Stronger U.S. Dollar Implications for Crude Oil Price
Commodities / Crude Oil Sep 04, 2014 - 12:26 PM GMTBy: Nadia_Simmons

 Trading position (short-term; our opinion): In our opinion no positions are justified from the risk/reward perspective.
On Tuesday, crude oil lost 2.70% as the combination of disappointing Chinese data and stronger U.S. dollar weighed on the price. Because of these circumstances, the commodity bounced down the medium-term resistance zone and approached the recent lows. Will they withstand the selling pressure?
Yesterday’s data showed that China’s official manufacturing index dropped to 51.1 in August, while the HSBC manufacturing index ticked down to 50.2. These disappointing numbers fueled worries over demand in the world's second-largest oil consumer and affected negatively the price of light crude.
Additionally, later in the day, the Institute for Supply Management reported that its manufacturing purchasing managers’ index increased to 59.0 in August, beating expectations of a drop to 56.8. Although these bullish figures confirmed that the U.S. economy continues to show signs of improvement, they also supported the greenback, which made crude oil less attractive on dollar-denominated exchanges. This was bearish for the commodity and pushed it to slightly above the recent lows. What’s next? Let’s check the technical picture of light crude and find out (charts courtesy of http://stockcharts.com).
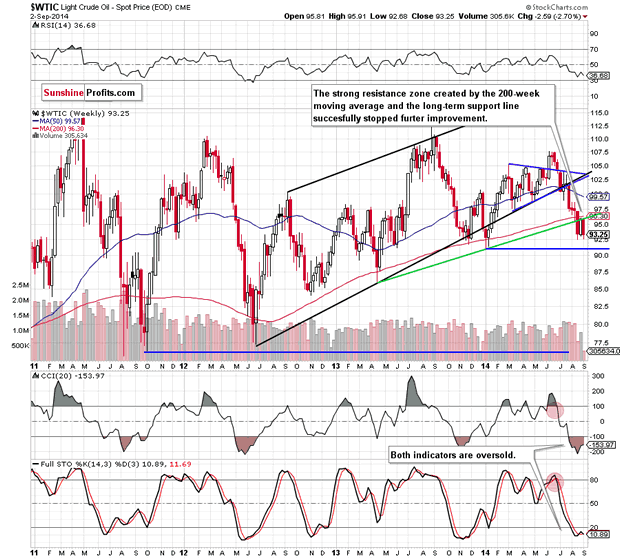
The weekly chart clearly shows that the strong resistance zone created by the previously-broken 200-week moving average and the rising, long-term support line, successfully stopped further improvement and the commodity reversed, declining sharply to around the recent low. This is a bearish signal, which suggests that if crude oil moves lower, the last week’s upswing will be nothing more than a verification of the breakdown and we’ll see a test of the strength of the Jan low of $91.24. At this point, it’s worth noting that although the CCI and Stochastic Oscillator are oversold, they didn’t generate buy signals, which could support oil bulls at the moment.
Will the very short-term chart give us more clues about future moves? Let’s check.
Quoting our yesterday’s summarize:
(…) Although the very short-term picture suggests further improvement as light crude remains above the upper line of the consolidation and buy signals are still in play, it seems to us that this medium-term resistance zone could trigger a pullback in the coming day (or days). If this is the case, we may see a comeback to the upper border of the formation.
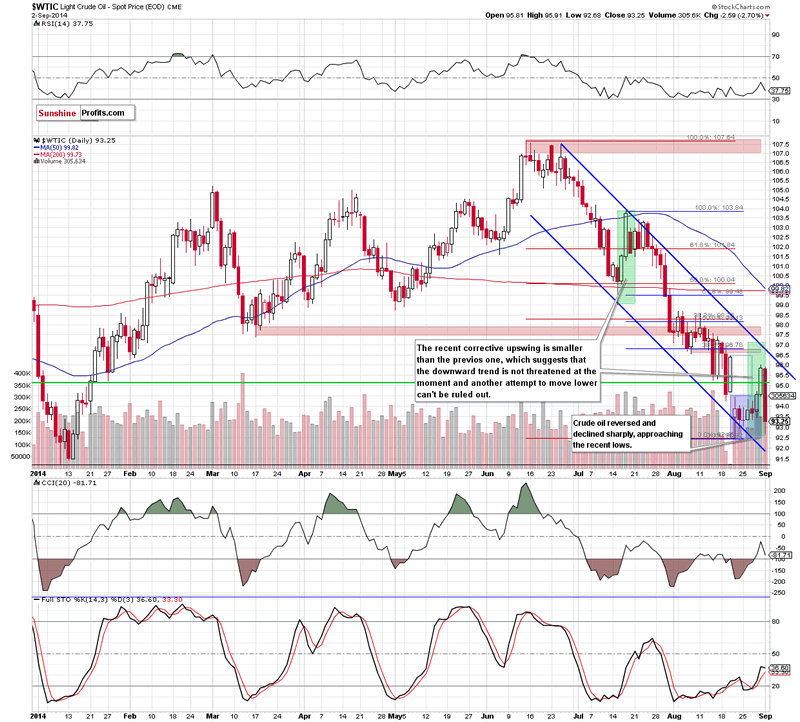
As you see on the daily chart, oil bears not only realized the above-mentioned scenario, but also managed to push the commodity lower and light crude approached the recent lows. Taking this fact into account, you’re probably wondering whether they withstand the selling pressure or rather we’ll see a test of the 2014 low.
From the technical point of view, this is the point from where crude oil should go north (at least later today) as the proximity to the support level will likely encourage some investors to push the buy button. But is this the right place to open long positions? Not really. The reason? Firstly, light crude is still trading in the declining trend channel, which means that even if we see a rebound from here, oil bulls will have to push the price above the upper line of the formation before we’ll see another sizable upward move. Secondly, as we mentioned earlier, crude oil still remains below the strong medium-term resistance zone, which keeps gains in check. Finally, when we take a closer look at the daily chart, we clearly see that the recent corrective upswing is much smaller than the previous one, which means that oil bulls are even weaker than they were in July. Therefore, in our opinion, the downward trend is not threatened at the moment and another attempt to move lower should not surprise us. If this is the case, we think that the next downside target will be the combination of the 2014 low and the lower border of the declining trend channel around $91.24-$91.50.
Summing up, the medium-term outlook remains bearish and in our opinion opening long positions is currently not justified from the risk/reward perspective. Yesterday, crude oil reversed and declined sharply, approaching the recent lows and as we have pointed out before, although we may see a rebound from here in the very short-term (especially if the EIA weekly report on crude oil inventories will be bullish for the commodity), it will not serve as a buy signal unless the medium-term resistance is taken out. We'll keep you informed.
Very short-term outlook: mixed
Short-term outlook: bearish
MT outlook: bearish
LT outlook: bullish
Trading position (short-term; our opinion): No positions are justified from the risk/reward perspective at the moment.
Thank you.
Nadia Simmons
Sunshine Profits‘ Contributing Author
Oil Investment Updates
Oil Trading Alerts
* * * * *
Disclaimer
All essays, research and information found above represent analyses and opinions of Nadia Simmons and Sunshine Profits' associates only. As such, it may prove wrong and be a subject to change without notice. Opinions and analyses were based on data available to authors of respective essays at the time of writing. Although the information provided above is based on careful research and sources that are believed to be accurate, Nadia Simmons and his associates do not guarantee the accuracy or thoroughness of the data or information reported. The opinions published above are neither an offer nor a recommendation to purchase or sell any securities. Nadia Simmons is not a Registered Securities Advisor. By reading Nadia Simmons’ reports you fully agree that he will not be held responsible or liable for any decisions you make regarding any information provided in these reports. Investing, trading and speculation in any financial markets may involve high risk of loss. Nadia Simmons, Sunshine Profits' employees and affiliates as well as members of their families may have a short or long position in any securities, including those mentioned in any of the reports or essays, and may make additional purchases and/or sales of those securities without notice.
© 2005-2022 http://www.MarketOracle.co.uk - The Market Oracle is a FREE Daily Financial Markets Analysis & Forecasting online publication.