


Gold and Silver Precious Metals Complex Contradiction and Potential
Commodities / Gold and Silver 2014 Sep 02, 2014 - 08:42 AM GMT

 In this report I'd like to look at some of the Precious metals stock indexes as there was a fairly strong reversal off of the previous lows made over the last two months. It was one of those inflection points where the PM stock indexes could have gone either way. It just so happened that they all had a decent bounce off the lows with the last two days being up. We'll examine some of the PM stock indexes in a minute but I would first like to show you the BPGDM as it's still on a buy signal that was generated three weeks ago.
The reading of 46.67 is the highest point the BPGDM has reached in about year so there is some underlying strength. The BPGDM is above the 5 dma and the 5 dma is above the 8 dma so the buy signal is in place. Also the price action is still finding support at the neckline of the potential one plus year inverse H&S bottom.

Lets look at the GDM which shows the price action this week hitting the bottom of the 2 month trading range and getting a nice little bounce. Reversal point #4 was the inflection point where GDM could have gone either way. Right now it's finding some resistance at the neckline of the small H&S top that formed at the top of the trading range. Friday GDM close back above the 50 dma. We're back to the same old question, is this 2 month trading range going to be consolidation pattern to the upside or will it end up being a reversal pattern to the downside. Since we don't know I'm going to play the trading range until the true trend emerges. Sometimes these types of trading ranges can go on for a long time with several more reversal points taking place.

Below is a daily line chart that shows a potential expanding triangle forming with last weeks low breaking below the previous low as a possible 4th reversal point. Again this can be a consolidation pattern or a reversal pattern once we get some confirmation one way or the other. The expanding triangle won't be complete until the top rail is hit a potential reversal point #5.

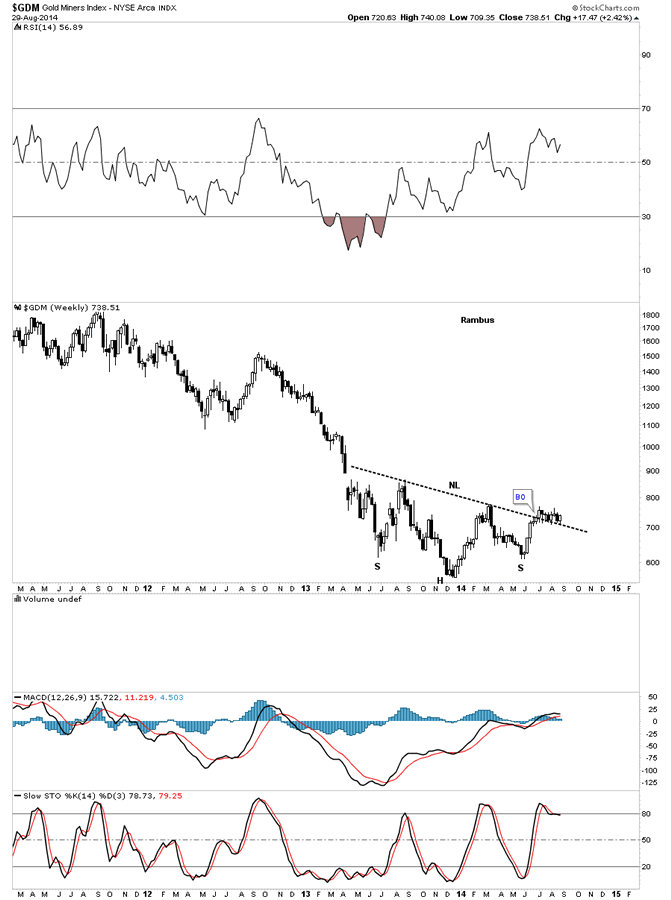
The weekly chart for GDM shows our potential inverse H&S bottom with the two month red trading range forming right on the neckline. The neckline held support again this week at 709 which is now a very important area to watch. I've added two price objectives if either the inverse H&S bottom or the red trading range plays out. Just keeping an open mind.

This next short term daily chart for GDM shows Sir Matrix's four horsemen's indicators that show the faster TSI and MACD crossing over with the longer term TSI and MACD getting close but not quite there yet.

This long term monthly chart for GDM show how we could see the potential inverse H&S bottom play out to the upside that would take the price action back up to the old neckline around the 1070 area. If that were to occur the bulls would say the bull market is back while the bears would view this as a counter trend rally in a bear market which would be the camp I would be in. As you know anything is possible. I think most PM investors are either really bearish or really bullish leaving little room for compromise. If GDM breaks out of the 2 month trading range to the upside then I think this scenario would come into play. On the other hand if the PM complex stalls out right here and the GDM breaks below the bottom of the 2 month trading range, taking out the neckline at the same time, then the bearish scenario would come into play. Right now all we really have to work with is the 2 month trading range which we'll trade until we get some confirmation of an impulse move either up or down.

Next I would like to show you some weekly charts for some of the PM stock indexes that shows the potential inverse H&S bottoms we've been following for a long time waiting for some type of resolution. Lets start with just a simple weekly chart for GDM that shows it's potential inverse H&S bottom. As you can see it has had a breakout and eight weeks of backtesting from the topside of the neckline.
The HUI has been one of the weaker PM stock indexes as it still hasn't really broke above its neckline confirming a breakout. You can see the price action bunching up just below the neckline.

The XAU still hasn't broken out yet either but it has tried several times to do so.

The GDX has broken out of its inverse H&S bottom in similar fashion to GDM and has been in backtest mode for 8 weeks now.

The GDXJ shows it too has broken out of it's inverse H&S bottom and is still in the backtest mode.

The GDLX, global gold explores etf, shows it has a potential double inverse H&S bottom but has failed to hold above it's neckline so far.

SIL shows what I call a 2 1/2 point double bottom with its 8 week consolidation pattern forming a red flag right on the S&R line.

You may have become aware that the PM stocks have been acting stronger than gold lately. The HUI:GOLD ratio chart shows you why as it has formed an inverse H&S bottom. Keep in mind both can fall together but if gold falls faster than the HUI the ratio will still show a rising price trend so it can be a little deceiving at times.

The weekly chart for silver shows its been walking down the black dashed S&R line that has been holding support since it was broken to the upside earlier this summer, reversing its role from resistance to now support. The million dollar question will it continue to hold support.

Silver's inflection point. This is the point where silver has to start showing some strength in here or it could be bad news for this precious metals. The situation can still be saved if it can start to rally immediately.

The daily chart for gold shows you the triangle we've been following in which I said to watch the potential 5th reversal point for a short term bounce and then the break of the bottom trendline. The other scenario was that if gold showed more strength down at the inflection point at reversal point #5 it was possible to see gold rally back up to the top rail. So far we've gotten the initial bounce now we have to see how strong gold really is if it can keep on rallying.

With the US dollar showing strength in here it will probably produce a headwind for the PM complex.

The Japaneses Yen is quite oversold right now and could see a backtest to the underside of the blue triangle it broke out of several weeks ago. This could give gold a little boost for awhile if that were to happen.

On this last chart for tonight I've overlaid gold on top of the yen. As you can see the correlation is pretty close. This past week tho the correlation wasn't as good as it has been. As I said it's not perfect but they generally run together.

I have spent a lot of hours this weekend going over many PM stocks from the juniors to the large caps. If, and this is a big if, if we see some strength this week in the precious metals stocks I will start posting some entry points for a short term trade. At this moment we are in the middle of the 8 week trading range so this is how we'll trade the PM complex until we see confirmation of a move one way or the other.. We'll sell at the top and buy the bottom. The stock markets are still in rally mode but with the SPX and the Dow trading at their all time highs we may see a little hesitation before going higher. It should be an interesting week as the summer doldrums should now be over.
All the best
Gary (for Rambus Chartology)
FREE TRIAL - http://rambus1.com/?page_id=10
© 2014 Copyright Rambus- All Rights Reserved
Disclaimer: The above is a matter of opinion provided for general information purposes only and is not intended as investment advice. Information and analysis above are derived from sources and utilising methods believed to be reliable, but we cannot accept responsibility for any losses you may incur as a result of this analysis. Individuals should consult with their personal financial advisors.
© 2005-2022 http://www.MarketOracle.co.uk - The Market Oracle is a FREE Daily Financial Markets Analysis & Forecasting online publication.