


Stay on Board - Stock Market Big Picture
Stock-Markets / Stock Markets 2014 Aug 18, 2014 - 11:21 AM GMTBy: Puru_Saxena

 BIG PICTURE - Over the past few weeks, geo-political tensions have increased in various parts of the world and we have also experienced a sovereign debt default. Despite these developments, the majority of the stock markets have held up relatively well and so far, we have not witnessed any panic-fueled liquidation of assets.
Although this can change, we are inclined to believe that these 'events' will not derail the primary uptrend in equities; and if anything, changes in the monetary landscape will bring about the next prolonged bear market.
Remember, when it comes to investing, monetary policy trumps everything else and the business (credit) cycle is dictated by changes in the cost of borrowing. When interest rates are low and credit is cheap, business activity picks up; and when borrowing costs rise, credit becomes tighter and economic activity slows down. Furthermore, the stock market is primarily driven by corporate earnings, so a slowdown or contraction in business activity brings about a bear market.
If you review Figure 1, you will observe that over the past 60 years, economic recessions in the US (shaded areas on the chart) have always occurred after a significant increase in the Fed Funds Rate. Put another way, not a single economic recession has come about without a prior rise in the Fed Funds Rate. This correlation clearly demonstrates that the economy (business activity) is directly controlled by the cost of borrowing.
Figure 1: Interest rate hikes precede recessions
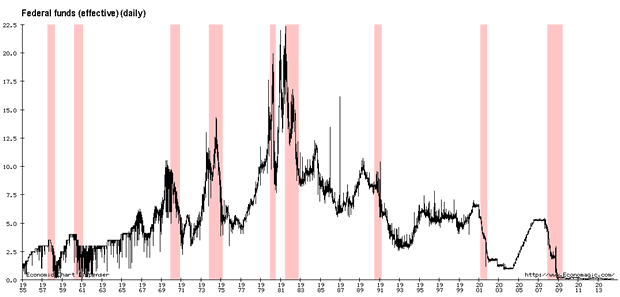
Source: www.economagic.com
As far as the stock market is concerned, it is worth noting that the previous prolonged bear markets (1974-1975, 2000-2003 and 2007-2009) coincided with economic recessions; which were brought about by the inversion of the yield curve.
Looking at the current situation, the Fed Funds Rate is still at a historic low and it is probable that Ms. Yellen will raise it sometime next year. Thereafter, if inflation expectations remain contained (probable outcome), it is likely that the Federal Reserve will raise the Fed Funds Rate in baby steps.
Although we do not possess a crystal ball, we suspect that the monetary tightening will go on until 2017-2018 and during this cycle, the Fed Funds Rate will peak around the 3-3.5% level.
Under the above scenario, the ongoing primary uptrend in stocks will probably continue for another 3-4 years, so we suggest that investors stay on board this powerful bull.
Look. The ongoing primary uptrend is now 5 years old, so there can be no doubt that we are now in a mature bull market. Nonetheless, given the favourable monetary policy and the timing of the US Presidential Cycle, it is probable that the next couple of years will be very good for Wall Street.
If you review Figure 2, you will note that since 1928, Years 3 & 4 of the US Presidential Cycle have been very bullish for US stocks. At the time of writing, we have arrived within three months of the third year of the US Presidential Cycle; a period which has proven to be extremely beneficial for American stocks. Thus, we believe that investors should get ready for an exhilarating ride!
Figure 2: US Presidential Cycle and the stock market
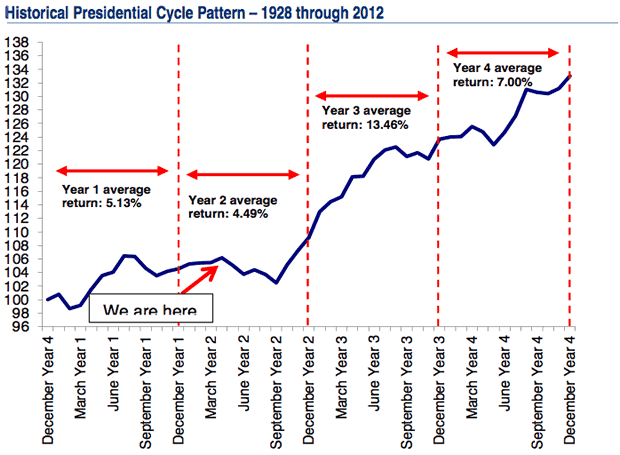
Source: BofA Merrill Lynch Global Research
Even though the broad stock market is likely to perform well over the following months, we do not believe that every industry group will participate in the festivities. Accordingly, investors will need to concentrate in the strong sectors and invest capital in the leading stocks. Conversely, in order to preserve capital, the weak industry groups will have to be avoided at all costs.
Narrowing in on the various industry groups, it is notable that asset management, automobiles, banks, biotechnology, healthcare, insurance, semiconductors, transportation and travel related stocks are performing well. Conversely, consumer discretionary, consumer staples, richly valued growth stocks and small-cap issues are currently out of favour with investors and unless the price action improves, these should be avoided.
Meanwhile, after a strong rally, it appears as though the energy counters are now undergoing a pullback (Figure 3) and this period of weakness may continue for several weeks.
For our part, we have recently made a few changes to our equity strategy and our portfolio is now well positioned in the strong sectors of the stock market.
Figure 3: Oil Index - digesting the recent gains?
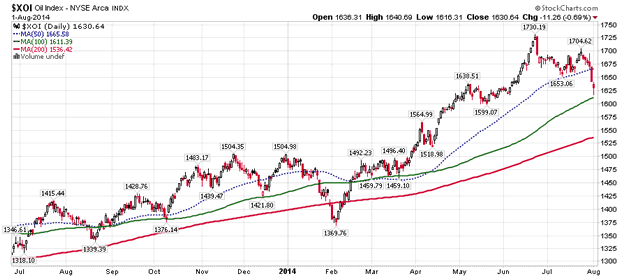
Source: www.stockcharts.com/
In terms of geographical exposure, it is worth noting that the stock markets of the developed world are performing well and even Japan's NIKKEI seems to have completed its lengthy consolidation phase. Given the fact that the Japanese Yen has started weakening again, it is probable that over the following months, the NIKKEI will surpass its last year's high.
Apart from the developed world, it is interesting to see that the stock markets of the emerging nations are also showing signs of strength and over the past few weeks, many prominent indices have broken out of lengthy trading ranges.
You will recall that in spring, we had highlighted India as an interesting investment opportunity. Today, in addition to India, we also see strength in Brazil, China, Hong Kong, Philippines, Singapore, South Korea, Thailand and Taiwan.
For our part, we have recently allocated some capital to the emerging world and it is our belief that this investment will produce satisfactory growth over the next couple of years. Make no mistake, from a valuation perspective, the emerging markets are inexpensive; so a 'catch up' rally could be on the cards. Furthermore, in the recent past, China has reported better than expected economic data and this is good news for the world's second largest economy as well as its major trading partners.
In summary, bearing in mind the accommodative monetary policy and the US Presidential Cycle, we are of the view that Wall Street will continue to advance for another 2-3 years. Undoubtedly, this will have a positive impact on the rest of the world, so investors should stay aligned with the primary trend. In terms of geographical allocation, we recommend that our readers stay overweight the developed world whilst maintaining a modest exposure to the emerging nations. Finally, as far as sectors are concerned, we advocate exposure to the cyclical counters which tend to perform well during a late-stage economic recovery.
COMMODITIES - Let's face it; commodities topped out in April 2011 and they are now in the grip of a secular downtrend.
During the past decade, the US Dollar was in a relentless downtrend and the Chinese economy was powering ahead. These two factors unleashed an epic bull market in commodities; an advance which continued for 10 years!
Today, the US Dollar is strengthening and the Chinese economy is slowing down. Thus, these two factors are now acting as a headwind for the prices of commodities. If our assessment is correct, the greenback will appreciate over the following months, thereby putting additional downward pressure on commodities.
If you review Figure 4, you will note that after advancing sharply at the beginning of the year, the Reuters-CRB (CCI) Index abruptly reversed course in April and it has now sliced through the key moving averages. Therefore, the path of least resistance is now down and additional strength in the US Dollar could bring last year's lows into play.
Figure 4: Reuters-CRB Index (daily chart)
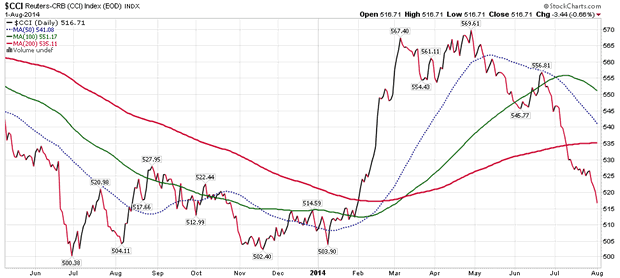
Source: www.stockcharts.com
Turning to specific commodities, it is noteworthy that despite the ongoing geo-political tensions in the Middle-East, the price of crude has fallen to a multi-month low and by doing so, it has sliced through the key moving averages. Therefore, the trend in oil is down for now and any rally attempt may fail around the US$100 per barrel level.
Elsewhere, the price of copper is still holding above the key moving averages and this is on the back of China's better than expected manufacturing data. Despite copper's resilience, we continue to believe that the metal is oscillating within a trading range and a strong rally is unlikely.
Finally, over in the agricultural complex, although coffee is experiencing a counter-trend rally, the prices of corn and wheat have declined to a 4-year low. Furthermore, the price of sugar has also fallen beneath the key moving averages and the path of least resistance remains down.
Given the bearish price action in commodities, the related stocks are also feeling the pressure, and it appears as though a pullback in these securities is now underway. Therefore, nimble traders can consider locking in their recent gains.
Puru Saxena publishes Money Matters, a monthly economic report, which highlights extraordinary investment opportunities in all major markets. In addition to the monthly report, subscribers also receive “Weekly Updates” covering the recent market action. Money Matters is available by subscription from www.purusaxena.com.
Puru Saxena
Website – www.purusaxena.com
Puru Saxena is the founder of Puru Saxena Wealth Management, his Hong Kong based firm which manages investment portfolios for individuals and corporate clients. He is a highly showcased investment manager and a regular guest on CNN, BBC World, CNBC, Bloomberg, NDTV and various radio programs.
Copyright © 2005-2014 Puru Saxena Limited. All rights reserved.
Disclaimer: The above is a matter of opinion provided for general information purposes only and is not intended as investment advice. Information and analysis above are derived from sources and utilising methods believed to be reliable, but we cannot accept responsibility for any losses you may incur as a result of this analysis. Individuals should consult with their personal financial advisors.© 2005-2022 http://www.MarketOracle.co.uk - The Market Oracle is a FREE Daily Financial Markets Analysis & Forecasting online publication.