


Forecasting Ability of the Elliott Wave Principle - Trader Education
InvestorEducation / Learn to Trade Aug 15, 2014 - 07:48 PM GMTBy: EWI

 The following article was written by Elliott Wave
International's Senior Instructor Jeffrey Kennedy to show what you can expect
from a market at the completion of various Elliott wave patterns. Jeffrey,
a Chartered Market Technician and highly sought-after speaker and teacher,
will host a free Trader Education Week, August 20-27. Learn
more now.
The following article was written by Elliott Wave
International's Senior Instructor Jeffrey Kennedy to show what you can expect
from a market at the completion of various Elliott wave patterns. Jeffrey,
a Chartered Market Technician and highly sought-after speaker and teacher,
will host a free Trader Education Week, August 20-27. Learn
more now.
Some people think the Wave Principle is complicated. But, in reality, all you need to know to find trading opportunities are the five core patterns: impulse waves and diagonals move in the direction of the larger trend; the zigzag, triangle and flat are corrective waves that move against that trend.
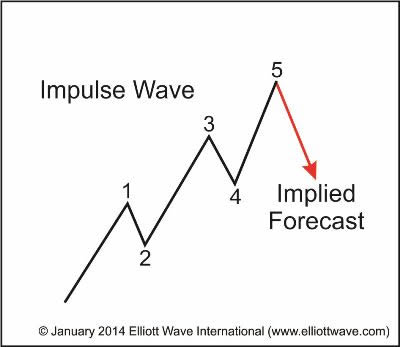
What is most important to understand about the Wave Principle is that each wave pattern implies a path for future price movement. For example, a completed impulse wave implies that prices will retrace into the span of travel of the previous fourth wave, most often to near its terminus. (See graph.)
As countertrend wave patterns, zigzags, flats and triangles imply that once they end, a complete retracement will follow. (See graph.)
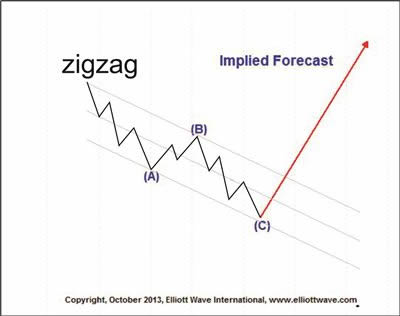
This chart shows a corrective pattern called a zigzag. It is a three-wave move that is typically contained in parallel lines, which I call the corrective price channel. Whenever you see an A-B-C decline such as this where, ideally, wave C equals the distance travelled in wave A, the implied forecast is a move to the upside back to beyond the origin of the pattern.
For example, the May through September pullback in SolarCity Corporation (SCTY) consists of three waves (a zigzag), which forecasts a rally beyond the May high.

The price chart of Pfizer Inc. provides another example of the forecasting ability of the Wave Principle. A triangle is a wedge-shaped corrective, or countertrend, wave pattern that is fully retraced upon completion.
As it stands, this pattern is incomplete and requires additional subdivisions. Even so, this structure implies that the larger uptrend is still intact and that new highs beyond $31.15, the point at which the triangle began, will ultimately develop.
|
Announcing Trader Education Week: Learn How to Spot Trading Opportunities in Your ChartsDon't miss this chance to learn even more from Jeffrey Kennedy with free lessons in an online video format. You'll learn:
Learn more and register for FREE now >> |

This article was syndicated by Elliott Wave International and was originally published under the headline 2 Examples of the Forecasting Ability of the Elliott Wave Principle. EWI is the world's largest market forecasting firm. Its staff of full-time analysts led by Chartered Market Technician Robert Prechter provides 24-hour-a-day market analysis to institutional and private investors around the world.
About the Publisher, Elliott Wave International
Founded in 1979 by Robert R. Prechter Jr., Elliott Wave International (EWI) is the world's largest market forecasting firm. Its staff of full-time analysts provides 24-hour-a-day market analysis to institutional and private investors around the world.
© 2005-2022 http://www.MarketOracle.co.uk - The Market Oracle is a FREE Daily Financial Markets Analysis & Forecasting online publication.