


Use "Magic" Of Gold/Silver Ratio To Greatly Increase Your Physical Holdings
Commodities / Gold and Silver 2014 Jul 26, 2014 - 08:31 PM GMTBy: Michael_Noonan

 The magic of compound interest is well known. What is lesser known is the magic of the gold/silver ratio, not as a measure as it is mostly viewed, but as an application for increasing one's holdings substantially, over time. What is so great here is that no magic is involved, rather simply utilizing the market to more than double your holdings.
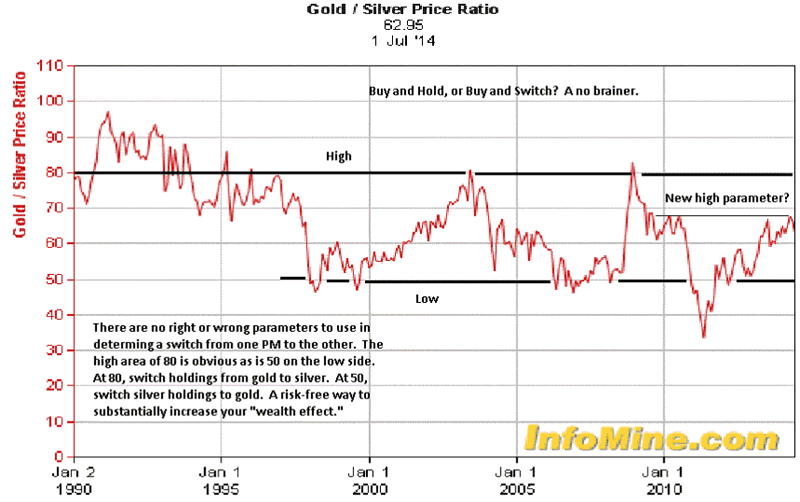
So-called "Gold Bugs" are considered ardent supporters of the PM [Precious Metal]. Silver stackers are just as avid. Then there are those willing to buy either or both. The chart below is the gold/silver ratio going back 15 years, and this is a hindsight analysis brought forth to the present tense for future consideration that can greatly increase net holdings at almost no cost, those being transaction costs from a dealer.
Consider three investors: 1. a gold-only buyer who loves gold. 2. a silver-only buyer who loves stacking. 3. A buyer of either or both and who wants to maximize what he [she] owns. [Transaction costs are not considered, and some rounding off may occur].
Buyer 1 bought 20 oz of gold in 1995 for $380 the ounce, or $7,600. Buyer 2 bought 1,000 oz of silver at $4.30 the ounce, or $4,300. Buyer 3 bought 20 oz of gold because the gold ratio favored holding gold, at the time. Buyers 1 and 2 safely stored their PM, relying on over 5,000 years of history that could increase the value of what they owned.
Sure enough, by 2014, buyer 1's 20 oz of gold are presently worth a tidy $26,000. Buyer 2's silver is now worth $20,500. Both have done well and are pleased with what they have. Buyer 3 had something different in mind, and that was to put the market forces to work in his favor and at no risk to his holdings. In what is to follow, there are no right or wrong decisions, just some that work better than others. Buyer 3 decided that at 80:1. gold over silver, silver would likely do better than gold, strictly from a gold/silver ratio perspective. Price was of no consequence for he was not selling his holdings, just switching from one to the other.
Buyer 3 decided to take his 20 oz of gold and exchange them for silver when the gold/silver ratio was at 80:1. 20 x 80 = 1,600 oz of silver exchanged from gold. He saw that 50:1 was strong support and favored gold to outperform silver. In 1999, he switched his 1,600 oz of silver back into gold. 1,600 divided by 50 = 32 oz of gold. Not bad. Now his original 20 oz of gold became 32 oz, irrespective of market price. It was the relationship between the two that mattered.
Around 2003, the ratio expanded back to 80:1, and his rule to switch from gold to silver came back into play. His 32 oz of gold x 80 translated into 2,560 oz of silver, giving him an added 960 from his last switch. Just like buyers 1 and 2, buyer 3 was at no risk of loss because he was always invested in one metal or the other.
In 2006, the gold/silver ratio declined back to 50:1, and that was buyer 3's signal to take his 2,560 oz of silver and turn it back into gold. 2,560 divided by 50 = 51 oz of gold. His original 20oz became 32 oz, and now he had 51 oz. Price was immaterial to his plan.
In 2009, the gold/silver ratio hit 80 again, and buyer 2 put his plan back into action, switching his 51 oz of gold into 4,080 of silver. His application of the "magic" of the gold/silver was working as planned, according to a few simple rules, his 80/50 rule, we will call it.
A few years later, in 2011, when the gold/silver ratio came back to 50:1, buyer 3 was ready. He took is 4,080 oz of gold and switched them for 81 oz of gold. All he did was observe where support and resistance were in the gold/silver ratio. It did not bother him in the least that the ratio went as low as 35:1 before turning back up. His plan and his rules for implementing it were more important than trying to outguess the market.
One thing he did observe was how the gold/silver ratio kept stalling at 68 area. Things change, like his original 20 oz changing to 81, and maybe the gold/silver ratio was in the process of change? Like we said, there are no right or wrong decisions, just some that work better than others. With that we are now in the present tense.
Buyer 3 has a decision to make. Wait for the 80:1 ratio, or recognize the possibility that the current 63:1 may be worth taking some action and switching because 68:1 has become resistance over the last 4 years. Buyer 3 could chose to hedge his bet, as it were, and just switch half of his gold holdings into silver at 63:1.
If the ratio does go back to 80:1, he can switch the remainder. If the ratio goes no higher than it has for the past 4 years and starts to decline lower, switching half his holdings at 63:1 made sense. What to do with the other half? What if 63:1 is a new high, maybe 35:1, or lower can become a new low? There are always decisions to consider, but there are none that are right or wrong.
Assuming buyer 3 waits for 80:1, he is now holdings 81 oz, up from his original 20 oz buy. Buyer 1's buy and hold strategy increased the value of his 20 oz to $26,000. Being neither a "gold bug" nor a "stacker," but just a "believer" in PMs, buyer 3's $7,600 investment is now worth $105,300. All three buyers were staunch "believers" in PMs, but buyer 3 held a more pragmatic belief in the magic of the gold/silver ratio, as opposed to buying and holding one or the other.
Let us add a 4th buyer who bought 1,000 oz of silver for $4,300 but also knew about the magic of the gold/silver ratio. He began to implement the same rules as buyer 3, but had started with silver, and not gold. Using the 80/50 rule, buyer 4 turned his 1,000 oz of silver into 51 ounces of gold, presently worth $66,300. The difference is buyer 4 started with silver and did not have the opportunity to start his plan until 1998, when the ratio was at 50:1. Presented for your own consideration.
Why do we show the same charts week after week? Because the market has not changed materially over the past many weeks/months. As long as the market has not changed, expectations that the price of gold and silver should not change, either. Expectations are future hopes/plans that may or may not ever be realized. Present market conditions are the reality of what is, without getting into the mental gymnastics about the degree of reality reflected in the charts. Market activity trumps everything, and one works with that reality or risks substantial loss by favoring opinion/hopes/expectations. There is nothing overt that stands out on the weekly chart. The fact that price closed in the middle of the TR [Trading Range], means that the level of information is at its lowest. Price can rally to the resistance area and fail, or decline to support and fail to go lower without violating the integrity of the TR. Buying or selling in the middle can be costly, either way.
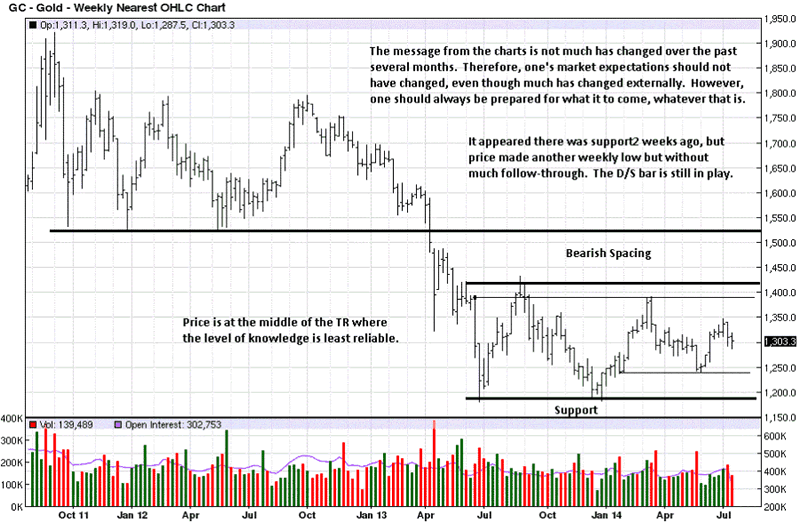
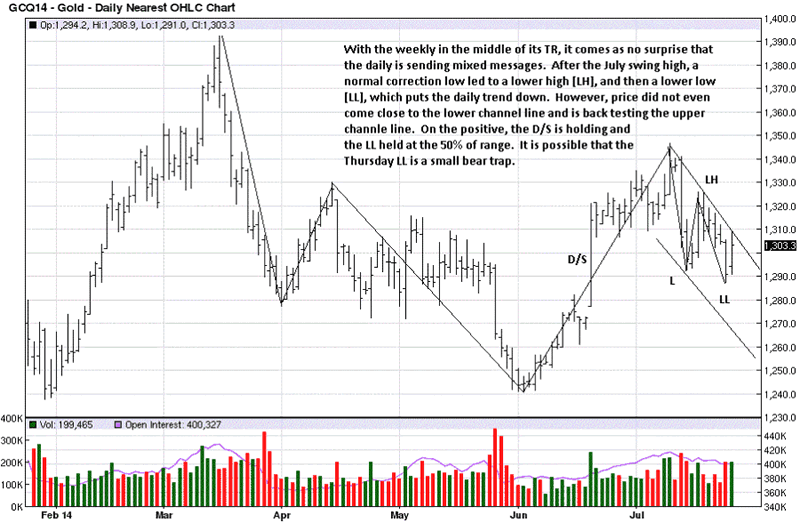
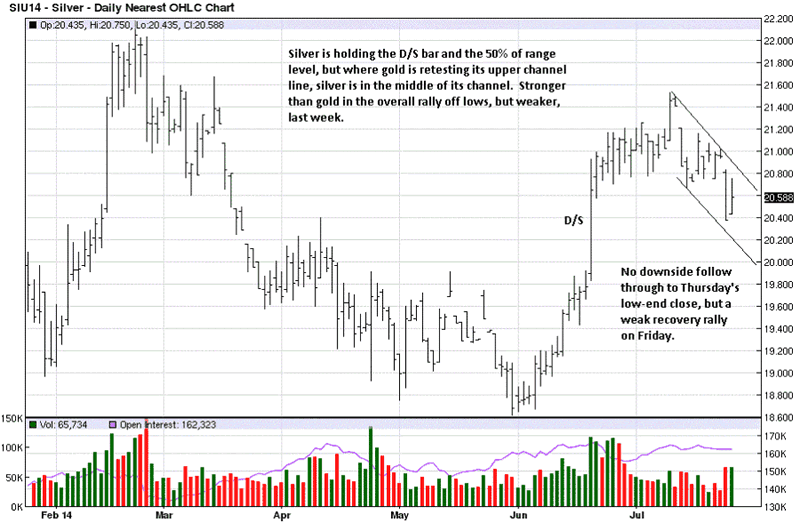
The D/S [Demand overtaking Supply] bar continues to hold as potential support. Gold has declined deeper into its D/S bar relative to silver, but it is doing better than silver by testing the upper channel line and holding the 50% on this decline. Price making a lower high and lower low puts the daily up trend in question. It looks like more of the same in the week[s] ahead.
The chart comments say what there is for silver. The trend remains down and rallies are not sustained. It is possible that the D/S will turn into a valid change of behavior and lead to a change in trend, but confirmation almost always comes after the fact. Just like in the gold/silver analysis, one has to wait for confirmation of the change and no try to [usually wrongly] anticipate it. In a down trend, time favors the sellers, not the buyers.
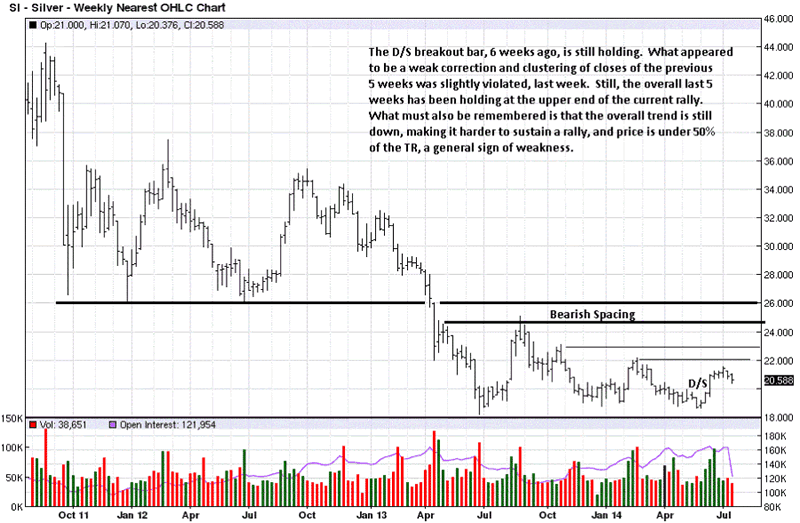
Where it looked like the daily performance in silver was relatively strong the past two weeks, Thursday changed all that with another strong sell day followed by a relatively weak rally. As with gold, there is nothing definitive for silver, either. For physical holders, adding at current prices is almost imperative for those who continue to buy. Adding the gold/silver ratio switch from one metal to the other, as the ratio dictates, gives another option in the on-going war of Western central banker destruction of paper currency in the service of trying to preserve it. That irony will prove costly to those not holding physical PMs.
By Michael Noonan
Michael Noonan, mn@edgetraderplus.com, is a Chicago-based trader with over 30 years in the business. His sole approach to analysis is derived from developing market pattern behavior, found in the form of Price, Volume, and Time, and it is generated from the best source possible, the market itself.
© 2014 Copyright Michael Noonan - All Rights Reserved Disclaimer: The above is a matter of opinion provided for general information purposes only and is not intended as investment advice. Information and analysis above are derived from sources and utilising methods believed to be reliable, but we cannot accept responsibility for any losses you may incur as a result of this analysis. Individuals should consult with their personal financial advisors.
Michael Noonan Archive |
© 2005-2022 http://www.MarketOracle.co.uk - The Market Oracle is a FREE Daily Financial Markets Analysis & Forecasting online publication.