


Gold Trend- What the Heck is Going On?
Commodities / Gold & Silver May 10, 2008 - 05:19 PM GMTBy: Merv_Burak

This is a difficult time for a gold analyst, especially when one doesn't REALLY know what the heck's going on behind the scenes. However, one must go on with whatever little intelligence one has and still make broad pronouncements. Let's see what the charts are telling us.
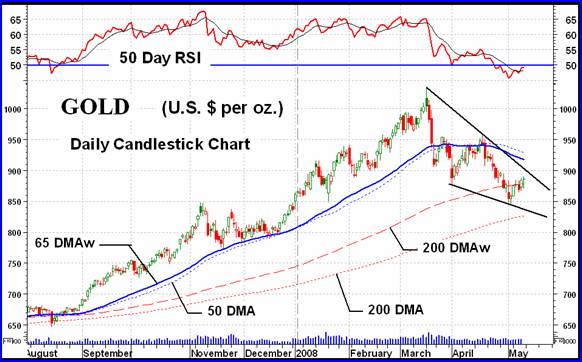
GOLD : LONG TERM
Having declared a P&F long term bear market last week there is no reason for suddenly turning around. What rally there was this week did nothing to the long term P&F chart. So, the P&F bear market continues.
As for the normal charts and indicators, going to the daily data versions, the action of the past week has been only a minor blib in the chart, from the long term perspective. However, from the normal indicators we had not yet declared a bear market and the action this week showed us why. The price of gold, which last week dropped below my weighted long term moving average line (but not the simple long term moving average, the two are shown in the intermediate term chart), has moved above the line this week. This simple move makes quite a difference in my ratings. With a momentum that continues in the positive zone but below its negative trigger line the long term rating moves back to the BULLISH rating.
This move below the moving average line and then very quickly back above it, while the line is still positive, is very often considered as a very bullish sign and a time to get back on the bandwagon on the up side. I would be a little cautious this time around although one may, at times, be too cautious.
INTERMEDIATE TERM
On the intermediate term readers know that I like to use a 65 day weighted moving average line rather than the more common 50 day simple line. The two are also shown on the chart. There is far less difference between these two than in the long term case, still very often the weighted moving average does give a signal one or two weeks earlier than does the common line.
On the intermediate term nothing much has changed during this past week of rally, at least nothing as far as the rating is concerned. Gold is still below its negative sloping moving average line and the momentum indicator remains in its negative zone, although it has moved above its positive trigger line. The volume indicator remains below its negative sloping trigger line but is very close to moving above the line. We have a downward sloping wedge pattern in force, which is usually a bullish pattern forecasting a move by the price above the upper trend line rather than below the lower one. For now, however, the intermediate term rating remains BEARISH , until confirmed otherwise.
SHORT TERM
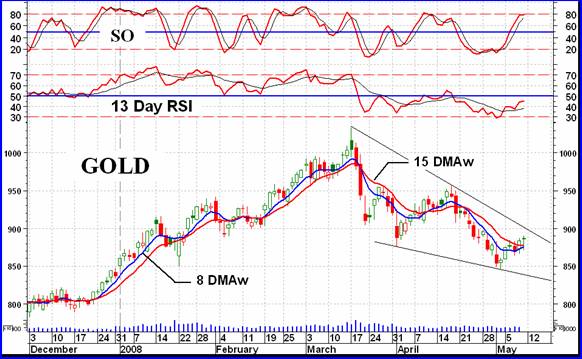
Gold has been on a rally most of the week. In the process it has moved above its short term moving average line and the line slope has just turned upward. Momentum is not quite at its neutral line but has moved above its trigger line with the trigger turning up. The action broke above last week's down trending channel so now the next break should be the wedge. Although the volume action is no great shakes compared to recent weeks the volume indicator is on a rise and is above its positive sloping trigger line. All in all, the short term has now turned fully BULLISH .
The immediate path of least resistance remains the up side. Gold is above the very short term positive sloping moving average line. The line continues to converge upon the short term moving average line but has not yet crossed above it for a confirmation of the short term bull. For the immediate or very short term direction, that is still BULLISH .
SILVER
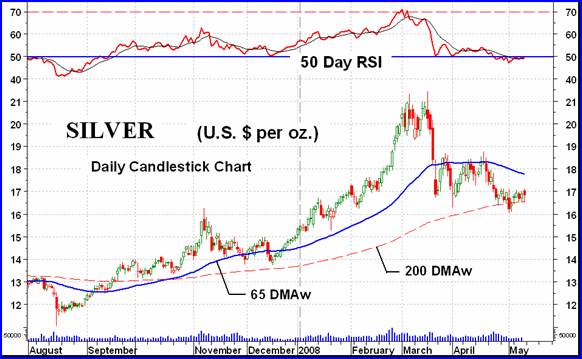
Although the silver chart looks very much like the gold chart (above) with the gold move looking like it is of greater magnitude, in fact the silver price made a bigger move from its August low to the recent peak. Of course the reverse often becomes true, i.e. the one that has the greater climb also has the greater decline. Here, silver has declined just a little more than gold, from their peaks. All that aside, both have a similar performance and ratings for the various time periods.
On the intermediate term silver is still below its negative sloping moving average line while the momentum indicator is below (only just) its neutral line and just on top of a lateral trigger line. The rating for all this is still BEARISH .
On the short term silver seems to have a resistance at the $17.15 level. Unlike gold during the week silver had more of a lateral move most of the week. It needs to break through that resistance for the short term to get go bullish. With the price above its still negative moving average line and momentum still in its negative zone, above its positive trigger line the short term rating is at + NEUTRAL for now.
GOLD STOCKS
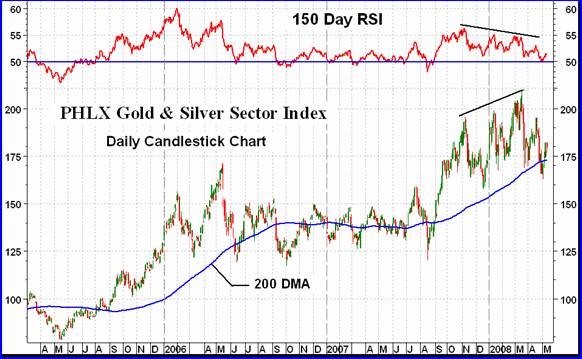
What most gold investors and analysts look at to see what the gold stocks are doing is the PHLX Gold & Silver Sector Index often just referred to by its symbol XAU . Although still up over 100% since its low in 2005 in actuality since its 2006 peak it has gone nowhere. During the past week the XAU advanced 6.3% which is near the high side for the major North American Indices. This is also slightly better than the Merv's Qual-Gold Index with its average performance for the 30 component stocks at 5.2%. In general it was the quality stocks that moved higher while the secondary and speculative/gambling stocks were progressively poorer performers.
A look at the chart of XAU does not give one a great deal of enthusiasm for the gold market. Although the Index is bouncing off its long term simple moving average line and the line itself is still positive the Index has gone nowhere for the past several months. The long term momentum indicator is bouncing off its neutral line but overall the indicator is suggesting weakness. This is seen in the lower lows and lower highs of the indicator versus higher lows and higher highs of the Index. Except for the short term the ratings remain BEARISH.
Despite the rally during the week this may still not be the time to be jumping in with intermediate or long term commitments.
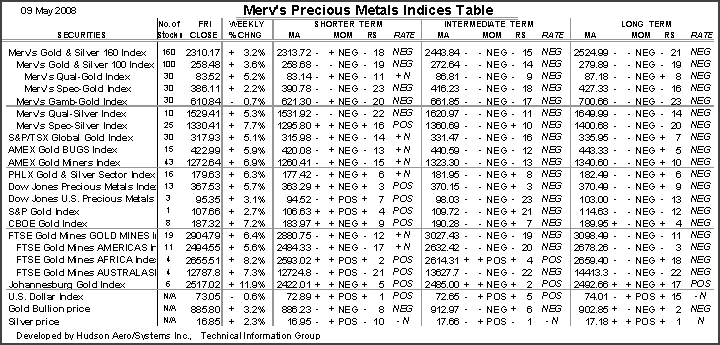
Merv's Precious Metals Indices Table
Well, that's another week.
By Merv Burak, CMT
Hudson Aero/Systems Inc.
Technical Information Group
for Merv's Precious Metals Central
For DAILY Uranium stock commentary and WEEKLY Uranium market update check out my new Technically Uranium with Merv blog at http://techuranium.blogspot.com .
During the day Merv practices his engineering profession as a Consulting Aerospace Engineer. Once the sun goes down and night descends upon the earth Merv dons his other hat as a Chartered Market Technician ( CMT ) and tries to decipher what's going on in the securities markets. As an underground surveyor in the gold mines of Canada 's Northwest Territories in his youth, Merv has a soft spot for the gold industry and has developed several Gold Indices reflecting different aspects of the industry. As a basically lazy individual Merv's driving focus is to KEEP IT SIMPLE .
To find out more about Merv's various Gold Indices and component stocks, please visit http://preciousmetalscentral.com . There you will find samples of the Indices and their component stocks plus other publications of interest to gold investors.
Before you invest, Always check your market timing with a Qualified Professional Market Technician
Merv Burak Archive |
© 2005-2022 http://www.MarketOracle.co.uk - The Market Oracle is a FREE Daily Financial Markets Analysis & Forecasting online publication.