


Stock Market - Is It 1999 All Over Again?
Stock-Markets / Stock Markets 2014 Jul 18, 2014 - 06:53 PM GMTBy: Clif_Droke

 The ebullient mood on Wall Street today was stimulated by a rash of merger and acquisition announcements.
Consider the following: In the energy sector, Kodiak Oil & Gas (KOG) agreed to be acquired by Whiting Petroleum (WLL), resulting in a sizable jump for both stocks. Among industrials, URS Corp. (URS) agreed to be acquired by Aecom (ACM), leading to 10-12% leaps for both stocks. Among health care companies, Shire Pharmaceuticals (SPHG) was reported to have accepted a $53 billion takeover bid AbbVie (ABBV); also, Mylan (MYL) announced a $5.3 billion deal to purchase a segment of Abbot (ABT).
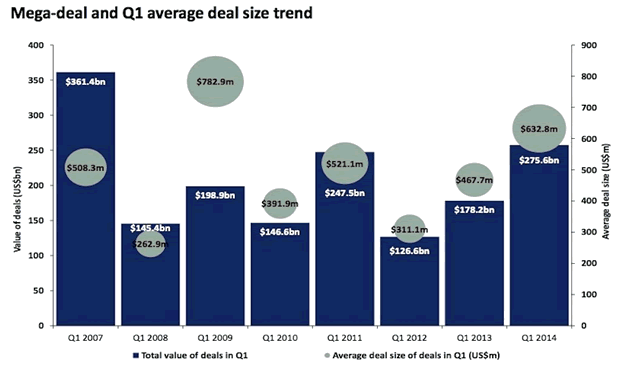
If you get the feeling that M&A is becoming bubbly, you'd be right. According to the Business Insider web site, the first quarter of 2014 witnessed the largest aggregate deal value since 2007 and the largest average deal size since 2007 (see chart below). In the second quarter alone, there were three U.S. merger proposals worth at least $40 billion, says MergerMarket's M&A Trend Report: Q1 2014.
Zacks, meanwhile, points out that M&A activity hit a 7-year peak as of June 26 with consolidate deal values increasing 75% year over year to $1.75 trillion. While it's true that the return of "merger mania" often marks the terminal phase of a bull market, it would appear that this particular M&A boom still has some room to run before topping out. Due to the enormous levels of cash on corporate balance sheets in recent years, not to mention record low interest rates and favorable credit markets, the M&A trend has had lots of fuel behind it.
So while the M&A trend is definitely building momentum, it hasn't yet turned into the dangerous "merger mania" episode of the 1990s. Mergers and acquisitions are symptomatic of the greed (or "irrational exuberance" as Alan Greenspan put it) which accompanies the late stages of a bull market. At some point, however, the trend will run to an extreme - just as it did in the late '90s - and will evoke its own reversal as per the "Rule of Alternation."
While we're on the subject of irrational exuberance, another newsworthy item came to our attention today which reminded us of the late '90s. Remember the Internet stock craze and the often ridiculous valuations (or lack thereof) behind many Internet startups of those days? Well it would appear that the bromide "history repeats" is playing out once again. A company operating under the name of Cynk Technology Corp (CYNK), which markets itself as a social network firm, is headquartered in Belize and has just one employee. Moreover, the company has no reported revenue and zero assets, yet its stock price has rallied 25,000% since June is now worth $6 billion as of last week.
Comenting on CYNK, options strategist Jacob Mintz of Cabot Options Trader said: "It appears to be a case of 'pump and dump' gone haywire. The SEC finally stepped in on Friday [Jul. 11] and halted trading of the stock due to concerns about "the accuracy and adequacy of information in the marketplace and potentially manipulative transactions in CYNK common stock." Could the stock symbol for this company turn out to be a prescient, yet ironic, commentary on the company's future?
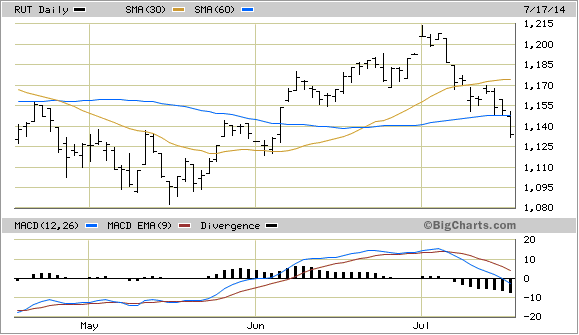
Although the Dow Jones Industrial Average (DJIA) and NASDAQ 100 (NDX) remain above their rising 30-day and 60-day moving averages as of Thursday, July 17, there are a couple of negative signs among the major indices. One such area of weakness is the small cap stocks. The Russell 2000 Small Cap Index (RUT) has recently made a negative divergence when compared with the other major indices. As of Thursday, RUT has even violated its 60-day moving average in a sign of major weakness. We'll need to closely monitor the RUT in the coming days since persistent weakness in the small cap stocks could eventually spill over into the broad market.
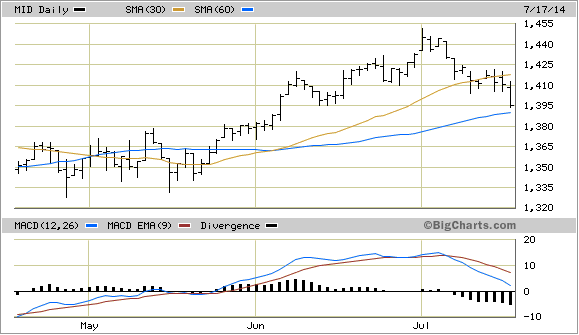
The S&P 400 Midcap Index (MID), an important leading indicator for the S&P 500, has also violated the 30-day MA and is about to test its 60-day MA. A decisive violation of this important trend line could set the stage for a "summer swoon" for the broad market. See the following chart.
New Concepts in Support & Resistance
Back by popular demand, the classic text on support and resistance techniques for predicting tops and bottoms in stocks and commodities is back. The book New Concepts in Support & Resistance integrates classical approaches of support and resistance analysis with new and exciting discoveries of stock and commodity price chart analysis.
Starting with some original observations and discoveries of the pastmasters R.W. Schabacker, Edward & Magee, W.D. Gann, and P.Q. Wall, New Concepts in Support & Resistance includes the added dimension of my own discoveries of this extremely important technical concept. Also included is an in-depth and detailed discussion of Parabolic Analysis and how to do it for maximum profits in your trading.
Support and resistance analysis is probably the single most important, yet widely overlooked, trading strategy components. This book explains to you in easy-to-understand terms all you need to know about it. The book is now available for sale at: http://www.clifdroke.com/books/newconcepts.mgi
Order today to receive your autographed copy along with a free booklet on the best strategies for momentum trading. Also receive a FREE 1-month trial subscription to the Gold & Silver Stock Report newsletter.
By Clif Droke
www.clifdroke.com
Clif Droke is the editor of the daily Gold & Silver Stock Report. Published daily since 2002, the report provides forecasts and analysis of the leading gold, silver, uranium and energy stocks from a short-term technical standpoint. He is also the author of numerous books, including 'How to Read Chart Patterns for Greater Profits.' For more information visit www.clifdroke.com
Clif Droke Archive |
© 2005-2022 http://www.MarketOracle.co.uk - The Market Oracle is a FREE Daily Financial Markets Analysis & Forecasting online publication.