


A Crude Interruption?
Commodities / Crude Oil Jul 04, 2014 - 02:07 PM GMTBy: Tony_Caldaro

 In the world of financial assets everything appears to be calm. Risk is on, CDS premiums and the VIX near all time lows, short/long term interest rates cheap, and central banks continue to flood the markets with liquidity. So how could a “black swan” arise from the ashes to disrupt the world’s economy?
We have some hot spots to consider. Argentina and Puerto Rico in default. The Ukraine/Russia conflict. A self-proclaimed Caliph in Iraq. So what could disrupt the markets complacency? Probabilities suggest the disruption will come from where it always comes from in recent times: the price of energy.
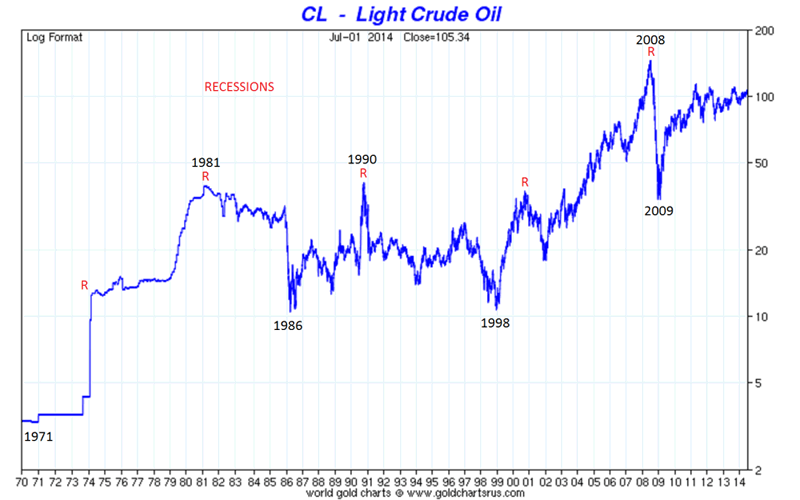
This is chart of the price of Crude oil since the year 1970. Notice the 10 year bull markets between 1971-1981 and 1998-2008. These bull markets were separated by a 17 year bear market. For those that follow OEW this is called the commodity cycle: typically 34 years long, but this one was only 27 years from bottom-bottom and peak-peak.
Notice the recessions of the early to mid 1970′s, and early 1980′s during the first bull market. Similar events occurred during the recent bull market: recessions in the early 2000′s and late 2000′s. After the 2008 peak Crude entered a bear market which should last about two decades. If the pattern replicates we should see a major low around the year 2025. During the last bear market, however, there was a spike that drove Crude nearly back to its highs, and this helped trigger the 1990 recession. All of the price rises for the past 45 years have been demand or geopolitically driven.
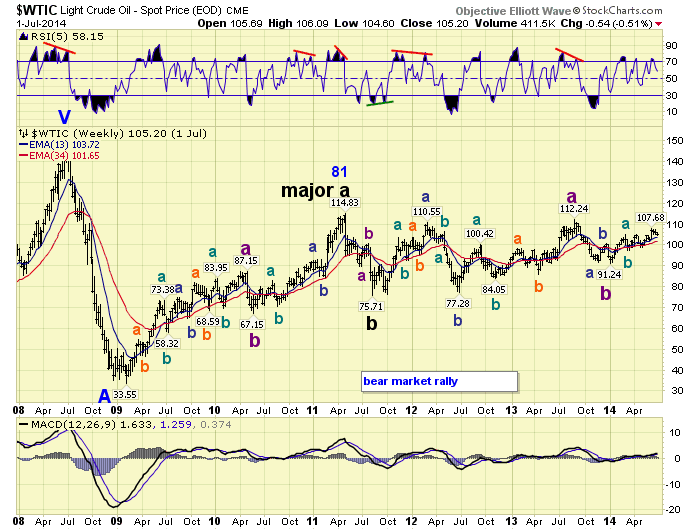
With this chart in mind we reviewed the wave structure of the Crude market long/medium/short term. The basic structure has not changed: bull market peak 2008, Primary wave A low 2009, and Primary B underway. We labeled the 2011 high as Major wave a, and 2011 low as Major wave b, with Major c underway. We had placed a tentative Primary B label at the 2012 high. After the recent review, we no longer feel that is appropriate. Major wave c appears to be still underway.
During the review we observed three five wave rising patterns, albeit overlapping, during Major wave a. The first completed in 2009, the second 2010, and the third 2011. This is a bear market rally so nothing unusual. During Major wave c we are also observing three overlapping five wave rising patterns. The first completed in 2012, the second in 2013, and the third is still underway. This analysis suggests Crude will exceed the 2013 $112.24 high this year, and the 2011 $114.83 either this year or next. Once it does, the probability of going back to the 2008 $147.27 is certainly possible. The one thing that the central banks can not control is the cost of energy and its effects on the global economy. Would suggest keeping an eye on Crude in the weeks and months to come.
CHARTS: http://stockcharts.com/public/1269446/tenpp
http://caldaroew.spaces.live.com
After about 40 years of investing in the markets one learns that the markets are constantly changing, not only in price, but in what drives the markets. In the 1960s, the Nifty Fifty were the leaders of the stock market. In the 1970s, stock selection using Technical Analysis was important, as the market stayed with a trading range for the entire decade. In the 1980s, the market finally broke out of it doldrums, as the DOW broke through 1100 in 1982, and launched the greatest bull market on record.
Sharing is an important aspect of a life. Over 100 people have joined our group, from all walks of life, covering twenty three countries across the globe. It's been the most fun I have ever had in the market. Sharing uncommon knowledge, with investors. In hope of aiding them in finding their financial independence.
Copyright © 2014 Tony Caldaro - All Rights Reserved Disclaimer: The above is a matter of opinion provided for general information purposes only and is not intended as investment advice. Information and analysis above are derived from sources and utilising methods believed to be reliable, but we cannot accept responsibility for any losses you may incur as a result of this analysis. Individuals should consult with their personal financial advisors.
Tony Caldaro Archive |
© 2005-2022 http://www.MarketOracle.co.uk - The Market Oracle is a FREE Daily Financial Markets Analysis & Forecasting online publication.