


Stocks Portfolio Correlation Based Diversification
InvestorEducation / Learning to Invest Jun 26, 2014 - 03:31 PM GMTBy: Don_Miller

 A Guy Leans on a Lamppost… and You Make a Buck
To paraphrase Scottish novelist Andrew Lang, some people use statistics like a drunk uses lampposts—for support rather than illumination. Numbers can be twisted and abused to support false claims, and even correct data is sometimes misinterpreted.
For example, you may often see claims like “an expert opinion poll showed that inflation next year will be 2.65%.” Looks legitimate, right? We have experts and a precise number; what else do we need? Well, there are at least three potential biases at work in this short statement:
- Who are the experts? Are they economists and/or statisticians with robust methods and a good track record, or are they just the ones who had the time to reply to this survey? There is a potential selection bias here.
- How large was the sample? There is a rule of thumb in statistics that for an average to even start having any weight at least 30 experts (assuming their track records are solid) should have replied. If only 5 or 10 did the average tells us nothing.
- And what’s with the two digits after the decimal point? It sure looks precise, better than, say a range of 2-4%. However, such precision is often an illusion, or what’s called “over-precision bias.” Imagine a recipe that tells you to take two tablespoons of flour, half a cup of sugar and other things and then says the pie you’re baking will have 512 kcal. I’d bet that pie would never have exactly 512 kcal even if you follow the instructions to the tee. Same with inflation predictions: when working with complex systems such as the economy adding extra digits after the decimal point is a cheap shortcut to achieving the appearance of precision. In reality a (rough) ballpark figure is the best we can get.
With that in mind I want to clear the fog around two critical statistical measures, beta and correlation, and explain how they can help you invest smarter. There are many other statistical measures out there, but these two are critical for a well-diversified retirement portfolio.
Correlation-Based Diversification: When “Weak” Offers Better Protection
Let’s start with correlation.
Correlation tells us how closely related two datasets are. The correlation coefficient ranges from -1 to +1. A correlation coefficient of -1 means the two measures are perfectly negatively correlated. If one goes up, the other always goes down. Plus, they do so simultaneously. If the correlation coefficient is +1, they move together in the same direction 100% of the time.
The three most important points about correlation are:
- Correlation only shows how two variables move in relation to one another over time;
- Correlation changes over time; and
- Correlation tells us nothing about cause and effect.
The old adage “correlation doesn’t imply causation” is popular because it’s true. Even if the correlation between two sets of observations is strong, one still might not cause the other. Other statistical measures try to estimate causation, but correlation is not one of them. It only tells us that when “A” happens, “B” is likely to happen too.
Here’s a scholarly example.
Correlation is important for diversification. The weaker the correlation between two assets in our portfolio, the better protected we are from negative movements in any one of them.
Bear in mind that correlation changes over time. The following chart shows the correlation of monthly returns between gold and the S&P 500. Each point on the line shows the correlation over the previous three years.
For example, the first number in the chart, -0.29, tells us that the correlation of monthly returns during the period of March 1975–March 1978 is -0.29. This tells us that for the preceding three years the relationship between gold and the S&P 500 was negative and quite weak. Thus, a portfolio of gold and the S&P 500 was well diversified before and at that date.
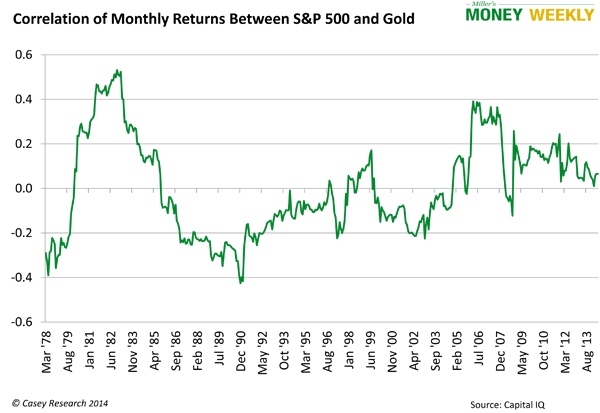
But as you see, this correlation fluctuated. It peaked at about 0.53 in 1983 and dropped to -0.43 in 1990.
The 1978 -0.30 correlation of a portfolio of gold and the S&P would not last. Gold’s returns followed the S&P much more closely in 1982, 1983, and 2006-2007. These relationships are not set in stone.
For retirement investors, the take-home wisdom about correlation is:
- Again, correlation changes over time. When you invest, try to pick assets with low (preferably negative) correlation to what you already hold;
- When you purchase an asset, consider how long you plan to hold it and how correlation may change during that time; and
- Most importantly, when the correlation does change, rebalance your portfolio to make sure it remains properly diversified.
For the Money Forever portfolio—a pioneer retirement portfolio built to safeguard your nest egg against its threat de jour, no matter what that is—we are using correlation to look for assets that are not strongly related to the US market right now. For example, the two latest additions to the Money Forever portfolio are: an international fund with an underlying index that includes companies located outside the United States whose income is denominated in foreign currencies; and, a high-yield dividend-paying energy play that is fantastic contrarian opportunity and a true global citizen—born in Norway, based in Bermuda and managed from London.
We are concerned about inflation, and holding these types of asset is one way to protect ourselves. For the international fund, we expect its value to rise if the value of the US dollar declines, and a correlation lower than that of another dividend-oriented fund we hold should protect us against a US market downturn even further.
Plus, the energy play I mentioned has income in a host of foreign currencies, providing an additional shield against the decline in the US dollar—and a 10% yield that’s well ahead in inflation to boot.
We also hold a certain household name whose products you likely have in your home right now. However, 70% of its business comes from outside North America. While it’s part of the S&P 500, its operating income denominated in foreign currencies should provide some inflation protection too.
“Is this a good hedge against inflation?” is part of the Five-Point Balancing Test we use to analyze investments. In effect, selecting holdings that should perform well when the US dollar loses value and that tend to move in opposite directions from the US market helps balance our portfolio.
Beta Measures Systematic Risk, Not Volatility
Now, let’s turn to beta. Chances are your online broker shows a beta number on the summary page of any stock you look at. What does it mean?
Beta measures an investment’s risk in relation to the market, or its “systematic” risk. Note that correlation measures the relationship between any two assets, but with beta one of them always represents “the market” or a benchmark. While correlation between the asset and the market shows us if they move in the same direction, beta also shows the magnitude of the relationship.
Historically, if a stock rose 2% when the market was up 1%, the correlation would be 1. They moved in the same direction all of the time, so the relationship is obvious.
Beta adds another dimension. If a stock gains 2% while the market gains only 1%, the beta will be 2. It not only shows the relationship (positive) but also its magnitude (x2). But there is a caveat.
A very common misconception about beta is that it measures volatility. This is inaccurate. Let me share a simplified beta formula to quickly illustrate this point.
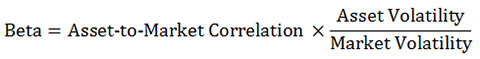
The formula suggests that an asset with low correlation to the market and high volatility has the same beta as one with high correlation and low volatility. The bottom line is that high beta alone does not tell us how risky an asset is.
The key takeaways are:
- Beta is not an all-encompassing measure of a stock’s risk.
- Beta depends on what you consider “the market.” Usually broad market indices like the S&P 500 are used to measure asset betas, but they are not the only option. If another benchmark is used, the beta of a particular investment will change.
- Like correlation, beta changes over time.
Unlike the drunk who uses the proverbial lamppost for support, we use statistics to test our premises. They help guide our thinking, but we don’t let them dominate it. Used correctly, they enrich our understanding and guide us to better investment decisions.
You can access our portfolio online right now and find out just what those decisions are by giving our monthly newsletter, Miller’s Money Forever, a risk-free try. Sign up today, and if our brand of “high-yield meets ultra-safe retirement investing” isn’t for you, just call or drop us a note and we’ll give you a 100% refund of every penny you paid, no questions asked.
Truth be told, the only way we could make it any easier is by sharing our entire portfolio right here, but we value our relationship with our paid subscribers too much to do that. So, sign up today and start counting yourself among them.
Disclaimer: The above is a matter of opinion provided for general information purposes only and is not intended as investment advice. Information and analysis above are derived from sources and utilising methods believed to be reliable, but we cannot accept responsibility for any losses you may incur as a result of this analysis. Individuals should consult with their personal financial advisors.
Casey Research Archive |
© 2005-2022 http://www.MarketOracle.co.uk - The Market Oracle is a FREE Daily Financial Markets Analysis & Forecasting online publication.