


I Give You: The GDP of Sillyland
Economics / Economic Statistics Jun 26, 2014 - 03:20 PM GMTBy: Raul_I_Meijer

 I had seen the reports on Italy and Britain preparing to add heroin and hookers to their GDP, but I had put that down to some kind of desperate quirkiness. Now, though, I heard today that this is actually due to an EU directive, and the number crunchers at Eurostat demand countries obey this newfound accounting magic trick.
Even saw someone claim that the reason behind it is that since drugs and prostitution are deemed legal in the Netherlands, both are already part of GDP there, and that to make the numbers compatible, other countries should add them as well. Because, obviously, it’s much easier to add to GDP numbers that are nothing but guesswork in the first place (apparently, police files are used), in 27 different countries, than to subtract them in one …
Governments will do anything to make GDP numbers look better, and it’s a miracle – or a testament to their intelligence – that none of them tried this one ages ago, in one form or another. And the moral highground knights who say one should not add the disease that is addiction, to positive GDP numbers, if only because it is damaging and grossly expensive to society, may well be right in that claim, but they forget that those negative and expensive consequences all boost GDP numbers just as much.
Medical treatment, insurance claims paid out for breaking and entering, the decay of entire neighborhoods, you name it, they count it as positive. Want to help the economy? Drive your car into a wall; or better yet, a schoolbus. Any real patriot should be on crack. Uncle Sam wants you! The essence is, in case this has still not trickled through, that destruction makes up a core – and huge – part of GDP.
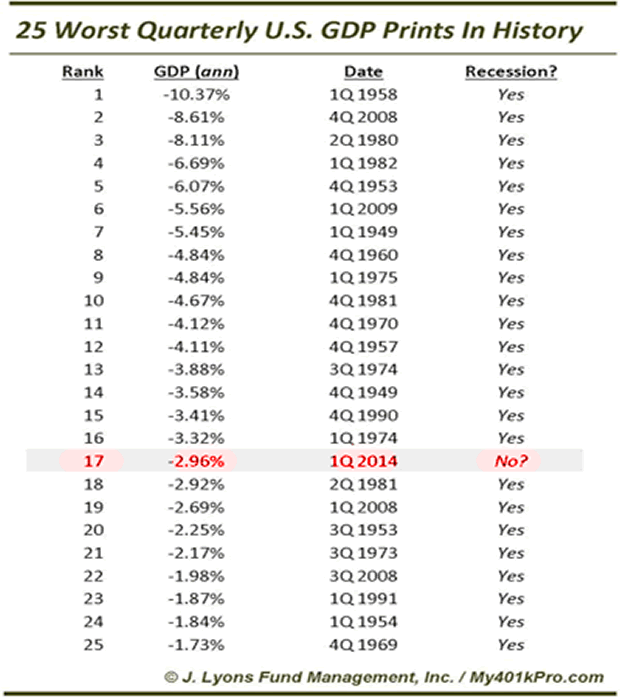
What Europe can do, America can do better, of course, though adding prostitution to GDP in the bible belt or in Utah may not be all that easy to do. But who needs it? Q1 GDP, as you probably know, was revised downwards to -2.96%, and that was a classic case of the thrown towel. Once it was obvious it would be negative, as was made clear in last month’s second revision to -1.0% , it didn’t matter much anymore how negative it would get. And that awakens the bit of creativity that exists among the data driven government crowd.
Whereas Obamacare numbers were initially used to make Q1 look less bad, they were now simply taken out, so Q1 got really ugly, but because of that Q2 can truly shine. Or so they think. I said yesterday that Q2 will be announced next month as 2.5%, but Tyler Durden may well be right, and it may be even higher, though I doubt they’ll go for Durden’s 5% estimate, or even Goldman’s 4%. Look, they don’t need to, the difference between -2.96% and + 3% is already big enough to create some stunning headlines with.
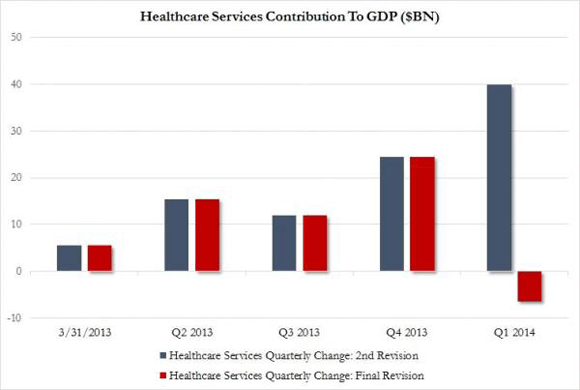
Still, the government is stretching it now in their faith of what they can make people believe. This graph Durden posted just baffles the mind. We understand what goes on, even if there’s no explanation forthcoming, and we understand that Obamacare was launched on January 1, and all sorts of things changed, but if you look at the differences here, and you realize that what you see is the discrepancy between this month’s final revision and last month’s second one, which came almost 2 full months after Q1 closed, you’d be inclined to ban the Department of Commerce ‘figure’ heads from ever coming near a calculator again.
Another thing Durden rightly points to is the marginal utility of debt, or the amount of GDP growth generated by an increase in debt. For Q1, US federal debt rose by $250 billion, while GDO dropped by $74 billion. in other words, debt doesn’t just not buy growth any longer, it actually diminishes it. This is not a new stat, and even China’s marginal utility of debt has been inching close to zero for a while now, and I’m sure there’ll be all sorts of explanations offered that why this was a one-off etc., but glancing over the revised numbers from the past 4 years, you can’t help thinking that this is what is meant but the Fed “pushing on a string”.
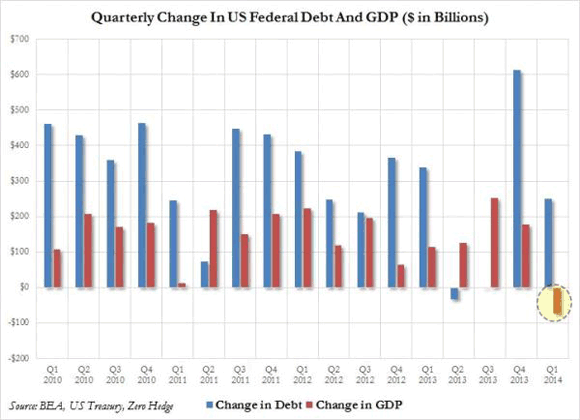
Q4 2013 is generally seen as quite good, but that’s just because federal; debt rose most in those 4 years, and still GDP rose by less than a third of the additional debt. Again, plenty explanations will be offered by pundits and bankers and statisticians, but if you simply add up all the differences between the added debt per quarter and the GDP growth it engendered, you must conclude you’re watching a losing game. And I know the guys in the Keynes jerseys will keep claiming it will get better, but they’ve been getting their asses kicked by the numbers since 2008 now, and, I have no doubt, longer than that. Despite the fact that, to stay in a soccer metaphor, they have the referees – the government number bureaus – in their corner. But then take one good look at this:
One last number from yesterday that I don’t think has gotten anywhere near enough attention is US exports, which were down a stunningly whopping 8.9%. That screams: how ugly would you like it? Like healthcare stats, something may have been moves forward to Q2 for that as well, but really, how bad was that winter? Were the ports all frozen solid that nothing could be shipped out? What happened there? And, perhaps more importantly, what will that number be for Q2? Will the figureheads be bold enough to come up with a, say, +5% export print, a 13.9% difference? And what will the explanation offered for that difference be?
We’ve entered Sillyland when it comes to GDP numbers, and governments are pretty desperately trying to figure how far they can go when it comes to making themselves and their stats look better than either really are. For now, they can rely on downward revisions of initially trumped up numbers, revisions that lag daily events by so much nobody cares anymore when they’re released. Even if longer term stats look absolutely awful, the focus will always be on tomorrow, not yesterday. Once you know how the human mind works, you use that knowledge to your advantage, right?
I’ll leave y’all with a question then: how do you think the US economy will overcome an 8.9% plunge in exports? Or a -2.96% GDP drop? What will go through your head when in a few weeks time the media will be filled with rosy and sunny and glorious data on how well “we” are doing?
Will today’s awful numbers still be right there in the front of your mind for comparison, or will they have faded? Q1 is almost 3 months ago, it’s so far in the past our propensity to filter out negative information has already done its job. That’s what your government counts on. Is your tolerance for deceit in numbers exhausted yet, or will you be easy prey once again?
By Raul Ilargi Meijer
Website: http://theautomaticearth.com (provides unique analysis of economics, finance, politics and social dynamics in the context of Complexity Theory)
Raul Ilargi Meijer Archive |
© 2005-2022 http://www.MarketOracle.co.uk - The Market Oracle is a FREE Daily Financial Markets Analysis & Forecasting online publication.