


GBP/USD – Another Fakeout
Currencies / British Pound Jun 24, 2014 - 09:08 PM GMTBy: Nadia_Simmons

 Earlier today, the British pound declined sharply against the greenback after Bank of England Governor Mark Carney testimony. Later in the day, sterling extended losses after data showed that Conference Board consumer confidence index jumped to 85.2 this month from 83.0 in May (it’s worth noting that this was the highest reading since January 2008), while the number of new home sales also rose to a six-year high, increasing 18.6% in May ( the highest level since May 2008 and the largest monthly increase since January 1992). These strong bullish numbers boosted the U.S. dollar and triggered a sharp decline in the GBP/USD pair. Where could the exchange rate drop after another fakeout?
In our opinion, the following forex trading positions are justified - summary:
EUR/USD: none
GBP/USD: none
USD/JPY: none
USD/CAD: none
USD/CHF: none
AUD/USD: none
EUR/USD
The situation in the medium term hasn’t changed much as EUR/USD is still trading in the consolidation between the support zone (created by the 38.2% Fibonacci retracement and last week’s low) and the June high, which is slightly below the long-term declining line at the moment. Let’s take a closer look at the very short-term chart.
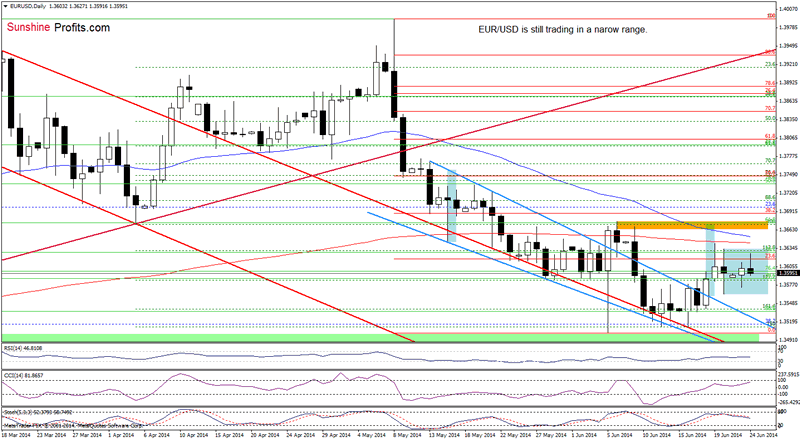
Looking at the above chart, we see that the situation in the very short-term remains unchanged as EUR/USD is still trading in a narrow range between Friday’s high and low. Therefore, what we wrote yesterday is up-to-date:
(…) slightly above the recent highs is the 200-day moving average, which successfully stopped further improvement on Thursday. Therefore, even if the exchange rate moves higher, it seems to us that history will repeat itself and we’ll see a pullback (especially when we factor in the proximity to the 50-day moving average and a sell signal generated by the Stochastic Oscillator). If this is the case, the initial downside target will be Friday’s low and if it is broken we’ll see another try to reach the upper line of the declining wedge.
Very short-term outlook: mixed
Short-term outlook: bearish
MT outlook: bearish
LT outlook: bearish
Trading position (short-term): In our opinion no positions are justified from the risk/reward perspective at the moment.
GBP/USD
On Friday, we wrote the following:
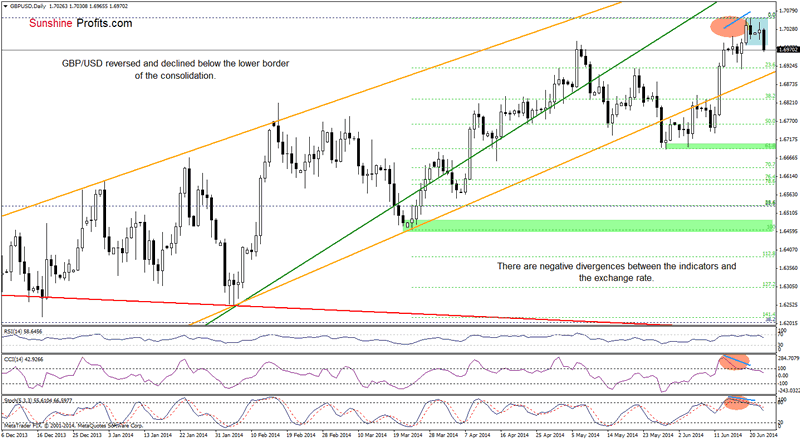
(…) GBP/USD climbed above the previous highs, hitting a fresh annual peak. (…) although this is a bullish signal, the breakout is unconfirmed. Additionally, it seems to us that we’ll call this upswing “the fakeout” as the RSI reached the level of 70, while the CCI and Stochastic Oscillator are overbought and very close to generating sell signals. On top of that, there are clearly visible negative divergences between these indicators and the exchange rate, which provides us with bearish implications, suggesting that a pause or correction is just around the corner. If this is the case, we think that the initial downside target will be around 1.6917, where the Wednesday’s low is.
As you can see on the above chart, the situation developed exactly as we expected it do - the exchange rate declined sharply, invalidating the breakout above the previous 2014 high. With this downswing, the pair also dropped below the lower border of the consolidation (marked with blue), which suggests that we’ll see further deterioration (especially when we factor in sell signals generated by all indicators) in the coming days and the initial downside target will be around 1.6905, where the size of a pullback will correspond to the height of the consolidation. At this point, it’s worth noting that slightly below this level is the medium-term support line, which may pause the current correction.
Very short-term outlook: bearish
Short-term outlook: bearish
MT outlook: bearish
LT outlook: mixed
Trading position (short-term): In our opinion no positions are justified from the risk/reward perspective at the moment.
AUD/USD
The situation in the medium term hasn’t change much. Today, we’ll focus only on the very short-term changes.
Quoting our yesterday’s Forex Trading Alert:
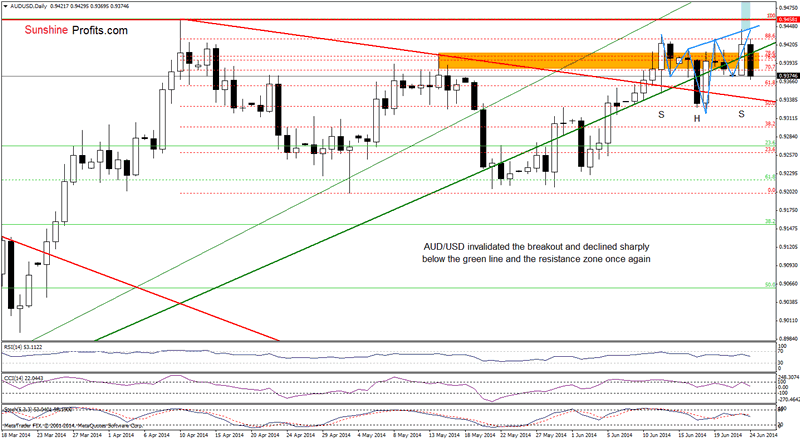
(…) AUD/USD rebounded sharply and invalidated the breakdown below the resistance zone and the green support line. Although this is a bullish signal, we saw similar price action in mid-June (and also in the previous week). Back then, this was a “fakeout”, which triggered a pullback in the following days. Therefore, it seems that we may see a similar correction from here in the near future.
Earlier today, we noticed such price action as AUD/USD reversed once again and declined sharply below the resistance zone and the green support line, reaching the right shoulder of an unconfirmed reversed head and shoulders pattern (marked with blue). If currency bears manage to push the pair lower, this formation will be invalidated and we’ll see further deterioration and a correction to around 0.9341, where the red declining support line is. If it is broken, the next downside target will be the June 18 low of 0.9319. Please note that the current position of the indicators supports the bearish scenario at the moment. Nevertheless, if the pair move higher from here, it seems to us that the combination of the resistance zone and the green support line will be strong enough to stop currency bulls.
Very short-term outlook: mixed with bearish bias
Short-term outlook: mixed
MT outlook: bearish
LT outlook: bearish
Trading position (short-term): In our opinion, no positions are justified from the risk/reward perspective.
Thank you.
Nadia Simmons
Sunshine Profits‘ Contributing Author
Oil Investment Updates
Oil Trading Alerts
* * * * *
Disclaimer
All essays, research and information found above represent analyses and opinions of Nadia Simmons and Sunshine Profits' associates only. As such, it may prove wrong and be a subject to change without notice. Opinions and analyses were based on data available to authors of respective essays at the time of writing. Although the information provided above is based on careful research and sources that are believed to be accurate, Nadia Simmons and his associates do not guarantee the accuracy or thoroughness of the data or information reported. The opinions published above are neither an offer nor a recommendation to purchase or sell any securities. Nadia Simmons is not a Registered Securities Advisor. By reading Nadia Simmons’ reports you fully agree that he will not be held responsible or liable for any decisions you make regarding any information provided in these reports. Investing, trading and speculation in any financial markets may involve high risk of loss. Nadia Simmons, Sunshine Profits' employees and affiliates as well as members of their families may have a short or long position in any securities, including those mentioned in any of the reports or essays, and may make additional purchases and/or sales of those securities without notice.
© 2005-2022 http://www.MarketOracle.co.uk - The Market Oracle is a FREE Daily Financial Markets Analysis & Forecasting online publication.