Gold and Silver Price Manipulation
Commodities / Gold and Silver 2014 Jun 20, 2014 - 04:02 PM GMTBy: Peter_Vogal
 There has always be manipulation, from the smallest levels (individual professional traders) to large size (Inv.Banks & Hedge Funds) and finally the government/central bank. The point I do not agree with is that they can "ultimately" control any market, even such as gold or silver despite their smaller size. The primary drivers of the markets are currencies and bonds because these are a reflection of the health (or illness) within a country's economy. Sure, even these can be moved by gov't policy changes (and moral suasion)(witness Japanese Yen 2012~2013), but for the most part, the free market forces are just too large for even the gov't to pump hundreds of billions per day to move them. Hence, any large enough change in those markets will eventually create a discrepancy between other related markets and consequently affect the stock and commodity markets around the world. No gov't can possibly stand in front of that train for long. If they could, then why did they let gold go up to $2000 and silver to $50?
The rapid decline in gold and silver since 2011 has certainly achieved its goal in shattering investor confidence, so its natural to want a reason such as market manipulation as vindication for having made an ill-timed investment decision. Escaping the psychology of those times without a doubt is a difficult task. But what about now, is the psychology any different?
Silver and gold was on everyone's bucket list for a decline to much lower lows, despite the fact gold and silver were witnessing strong accumulation by professionals - long silver future contracts in early June stood at about 70,000 or the equivalent of 350 million oz. of silver. This is a significant increase since last summer, all the while silver has been testing its lows. On the flipside, speculators increased their short positions to 50,000 contracts, not far off its 15-year record set last December, and compare that to the 15-year average short position of 22,000 contracts.
Both the longs and shorts in silver are showing their strong conviction. Who do you think will ultimately win, the commercial/professional traders or the speculators? This is what you call a Colt 45 loaded with a silver bullet. Now that the bear pundits got shot, perhaps they can declare manipulation to the upside or stealthily become bullish.
Here's what InvestorKey had to say about precious metals in our blog on June 4 titled "Gold's Time to Shine":
"...gold would go to its next support at around the $1200 level, but now this current correction also looks like it may be cut short. We have stated our position several times that the late June 2013 and December 2013 bottoms were significant and the pattern developing is a head and shoulders bottom in precious metals equities. We think the bottom of the final right shoulder is at hand and that investors should prepare to position themselves for the rally that should ensue."
"A failed breakdown usually results in a rapid move up, so positioning must be done without hesitation."
"Secondly, there is a strong possibility that the stock market may correct, but preferably, if the stock market continues to rise, then the precious metal stocks will rise even stronger. We still 'strongly' believe golds time to shine is near."
We were clear about the bottoming process in precious metals in July 2013, Jan 2014 and Jun 2014. There were painful moments, however, as well, where we were stopped out during nasty whipsaws that would take out previous highs or lows by a few cents. Despite the pain, our confidence in understanding markets comes from our experience in ratio analysis.
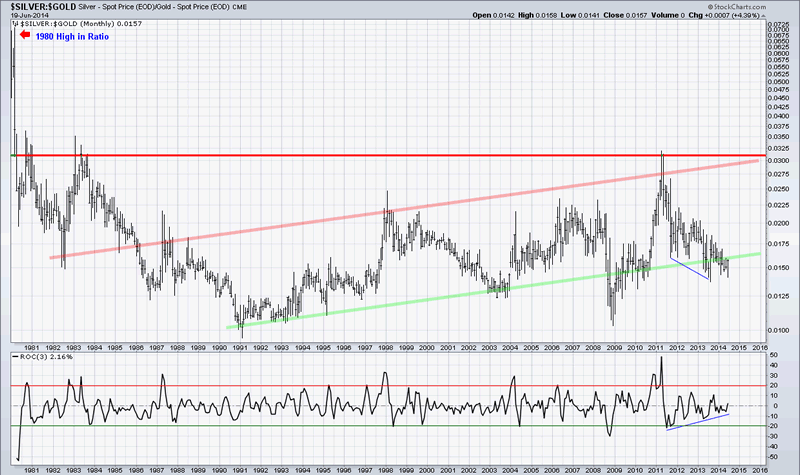
Another technical supporting factor for a move up in precious metals is the Silver/Gold ratio which is currently in undervalued buying range as shown by the green lower trend channel line that has marked lows in the silver price during the last 25 years. Further supporting that silver is building for a move up is the 3-month rate of change momentum in the lower panel that shows positive momentum building.
We believe the support level on silver and gold is formidable and that the current move is initiating the next major trend.

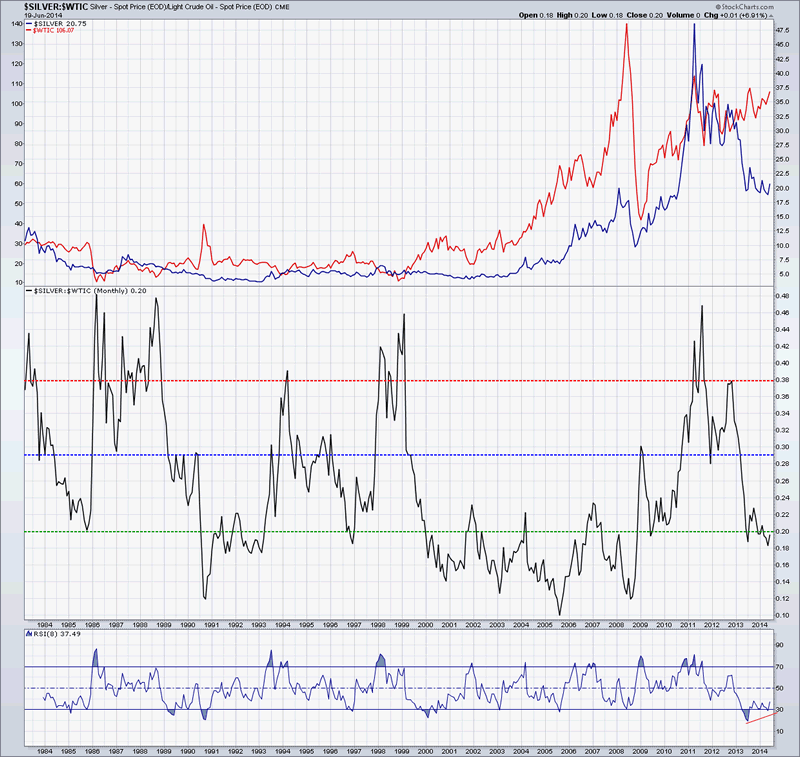
The second chart is a monthly Silver/Oil ratio back to 1983 that clearly shows the overvalued and undervalued levels of Silver verses Oil. The top panel shows Oil in red(price left scale) and Silver in blue(price right scale). Since 1998, the only period Silver clearly outperformed Oil was from the 2008 low to the 2011 high. From an investment perspective, investing in Oil would have been better than the precious metals. Currently, we are again in oversold territory showing Silver being undervalued relative to Oil, which in the past has also correlated well with the lows in silver. The RSI momentum is in oversold territory and there appears to be a divergence developing.

The reason these ratios are important, is because they show "relative value", meaning it can reveal the truth behind the price of an individual asset. Looking at only the price of an individual asset, such as silver, gold, bonds, stocks may not always reveal the true direction. Relative values can be many different ratios representing many assets, hence manipulating ratios would be an impossible task, as the capital required would be untenable.
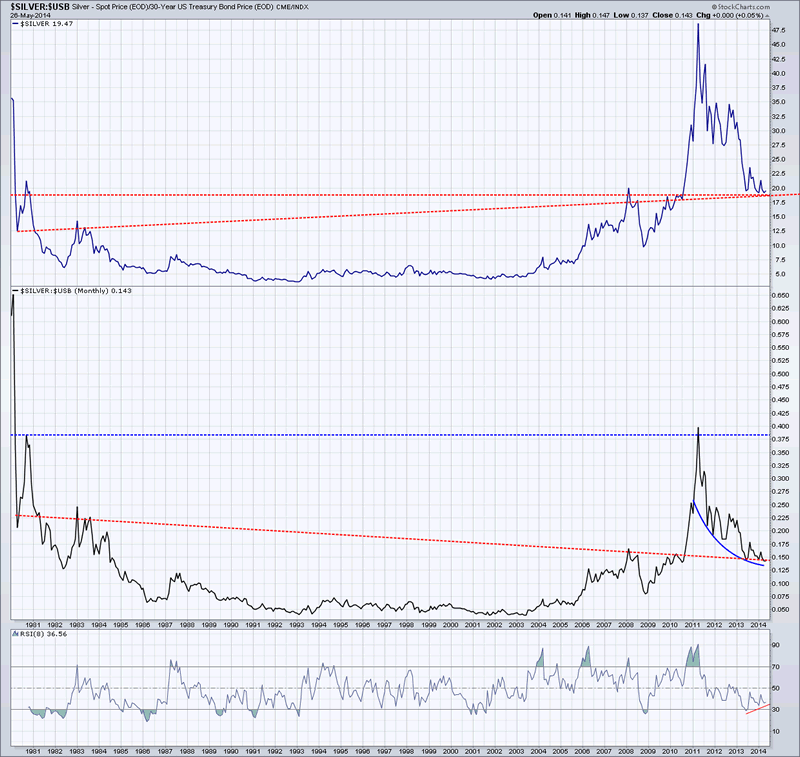
The 3rd chart is the Silver/30-Yr Bond ratio back to 1980, with Silver plotted in the top panel. A note on the Silver chart; no matter how you draw the neckline from the early 1980's through the 2008~09 highs, they both end up as support directly under the price during this last 11 months. Likewise, the ratio in the Silver/Bond chart shows the exact same resulting neckline and support. Can that really be coincidence or a manufactured result? The argument of manipulation may hold some truth, but from a technical perspective the price decline over the last 3 years in gold and silver needed to happen. Whether the root cause is manipulation, the psychological cycles of mankind, or act of God is completely irrelevant.
The Silver/Bond ratio is also showing signs of a rounding bottom and the RSI momentum appears to be completing a third trough divergence against price, generally recognized as the last trough before the more significant move begins.

Using a top-down approach, we provide short and medium term daily signals on the charts similar to those above in our blog.
In our June 12 blog titled "What You Can't See", we gave this advice:
"As to which ETF amongst the precious metals will be the best performer, that would appear to be the Junior Miners-GDXJ. Below you can see the GDXJ history going back to the previous high in late 2012 and the subsequent downtrend lines. Recently, in June 2014, we broke out of a small channel resistance (dotted blue lines) and a horizontal resistance today at the $37.50 level. This suggests the GDXJ price should go up to at least $40 as marked by the long downtrend line. Whether we hesitate or pause longer has yet to be determined. Based on today's breakout, it would probably be prudent to have a portion of ones funds in this etf, as the upside target is in the 60~70 level."
"This is a powerful pattern and the price gaps are not usually filled on a pullback. Furthermore, the price move over the last few days on all the precious metal etfs is looking more impulsive (meaning large daily price moves) and that suggests it should continue up strongly. Hence, again, it is probably wise to have some kind of position now, then add to it on any correction. The SIL has not yet broken its downtrend since Mar 2013, but that would likely happen next week based on momentum."
"While we can't say for certain that we will see a pull back in the price of the precious metals etfs from these levels, we are confident that the resumption of the secular bull market is occurring."
This is an important time to be on the right side of the precious metal and commodity markets and soon the stock market as well. As an investor, one of the most important things you should do right now is look back to the first 10 days of June and review the articles that were bearish and bullish, look to see if there is any valid foresight in their reasoning or whether they are just blowing with the wind. If you were caught empty-handed on this move as a result of something you read, then maybe its time to turn the page.
Disclosure:
We currently hold positions in the following equities:
Silvercrest Mines - SVLC
Junior Gold Miners - GDXJ
Globe X Silver Miners - SIL
Peter Vogel
InvestorKey
Peter Vogel began his investment career in 1981, first as a Floor Trader and then as an Investment Advisor for a major securities firm. During that time he acquired several securities and options licenses and became registered as a Commodity Trading Advisor (CTA). He also co-founded a venture capital organization that helped finance and commercialize a number of new technologies. Since the beginning of his 33+ years of investing, he developed his own style of technical analysis by focusing on ratio analysis and money management techniques, creating methods that often allow him to buy near precise turning points with confidence.
Copyright © 2014 Peter Vogel- All Rights Reserved
All ideas, opinions, and/or forecasts, expressed or implied herein, are for informational purposes only and should not be construed as a recommendation to invest, trade, and/or speculate in the markets. Any investments, trades, and/or speculations made in light of the ideas, opinions, and/or forecasts, expressed or implied herein, are committed at your own risk, financial or otherwise. The information on this site has been prepared without regard to any particular investor’s investment objectives, financial situation, and needs. Accordingly, investors should not act on
© 2005-2022 http://www.MarketOracle.co.uk - The Market Oracle is a FREE Daily Financial Markets Analysis & Forecasting online publication.


