


EURUSD On The Cusp
Currencies / Euro Jun 20, 2014 - 03:08 PM GMTBy: Austin_Galt

 Let's begin the analysis by looking at the yearly chart.
YEARLY CHART
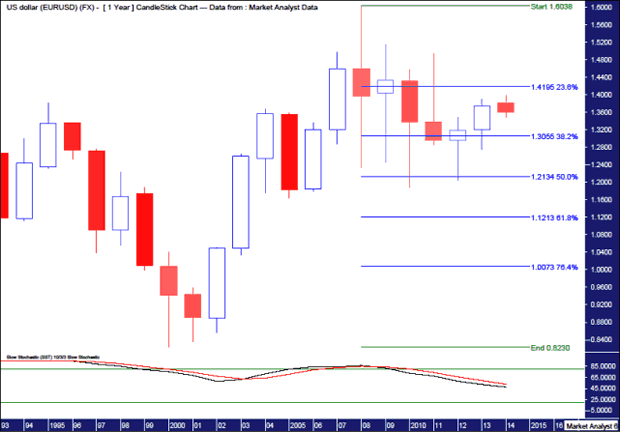
Quite frankly, I took one look at this chart and was stumped. So let's break it down. We have a lower low set in 2000 at 82.3 followed by a higher high set in 2008 at 1.604. Fat lot of good that is! Since then price has generally fallen to where we are now around 1.36. So where to next? Good question. I'm not sure this chart gives me a decent answer. I've added a Stochastic Indicator which can be seen to be trending down so perhaps there is lower to go this year and into next.
I've added some Fibonacci retracement levels of the whole move from low to high. The 50% level looks to have provided good support after a couple of tests. That's something I guess. Nothing really solid here though so let's move on.
MONTHLY CHART
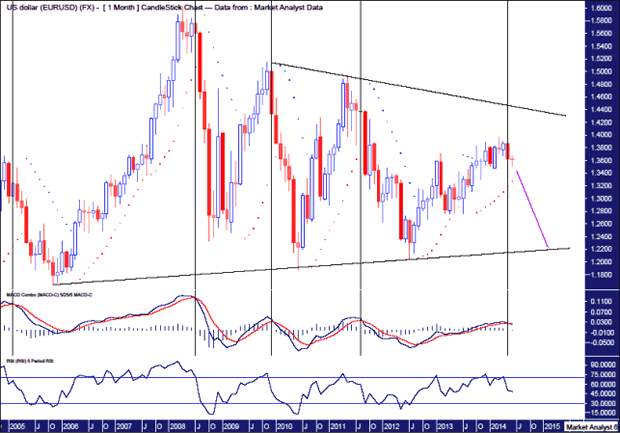
This is better. Some interesting observations to be made here on the monthly chart. Firstly, I've drawn some trend lines across tops and along bottoms. There appears to be a big consolidation pattern playing out. Question is, will price now head to the top trend line or the bottom one? To answer that question I've added a Moving Average Convergence Divergence Indicator (MACD) and a Relative Strength Indicator (RSI).
The theory behind the MACD is that when two averages cross each other, a significant change in trend is more likely to occur. We can see on this chart that just last month the two averages crossed. Voila! In this case the red line is crossing above the blue line. I have drawn black vertical lines at every point on the chart this has occurred. And look what has happened on each occasion after this has happened. A big move down has ensued. Now there is no 100% foolproof system to be had in the market but going on previous form this does look ominous.
The RSI is currently showing a reading below 50 so the charts strength is just on the weak side and it is trending down. So conditions are ripe for a significant move down.
WEEKLY CHART
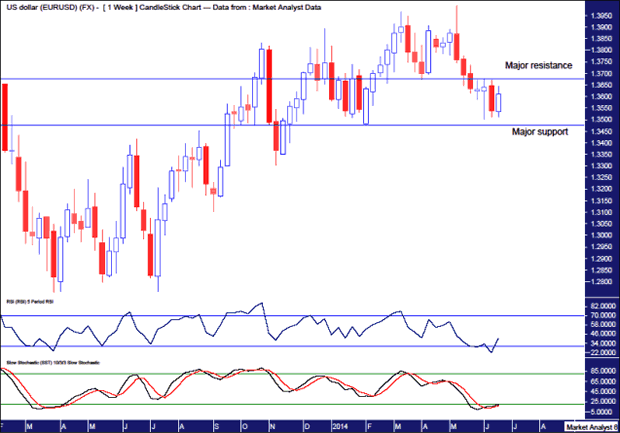
On this weekly chart I've added some major support and resistance levels. Support stems from the February low of 1.3477 while resistance stems from this month's high price of 1.3676. A break of support would mean a lower low is in the making while a break of resistance will mean a higher low is in place. So, as it stands currently, the EURUSD appears on the cusp of a significant move. Both the yearly and monthly suggest a move lower is more likely but what does the weekly reveal.
I have added both RSI and Stochastic indicators. Both are currently showing weak readings. Now while a move higher is clearly an obvious option, it is at these exact points that large moves down can occur. This plays to my contrarian way of thinking. A lot of chartists will think the readings are too weak and so there must be a rally but this appears too obvious. And whenever I see something obvious the sirens in my head start going off.
One final thing to note is that the last few weeks action appears to be a consolidation. And the general rule is that whichever way price comes into the consolidation pattern is the way it will leave the pattern. In this case down.
Summing up, the EURUSD train looks set to leave the station next week. But which direction will it go? My analysis leads me to believe it's the southbound train. Choo choo.
Bio
I have studied charts for over 20 years and currently am a private trader. Several years ago I worked as a licensed advisor with a well known Australian stock broker. While there was an abundance of fundamental analysts there seemed to be a dearth of technical analysts, at least ones that had a reasonable idea of things. So my aim here is to provide my view of technical analysis that is both intriguing and misunderstood by many. I like to refer to it as the black magic of stock market analysis.
Please register your interest in my website coming soon. Any questions or suggestions, please contact austingalt@hotmail.com
© 2014 Copyright Austin Galt - All Rights Reserved
Disclaimer: The above is a matter of opinion provided for general information purposes only and is not intended as investment advice. Information and analysis above are derived from sources and utilising methods believed to be reliable, but we cannot accept responsibility for any losses you may incur as a result of this analysis. Individuals should consult with their personal financial advisors.
© 2005-2022 http://www.MarketOracle.co.uk - The Market Oracle is a FREE Daily Financial Markets Analysis & Forecasting online publication.