


Gold and Silver June Lows Often Mark the Beginning of a Long Rally
Commodities / Gold and Silver 2014 Jun 20, 2014 - 08:39 AM GMTBy: Peter_Degraaf

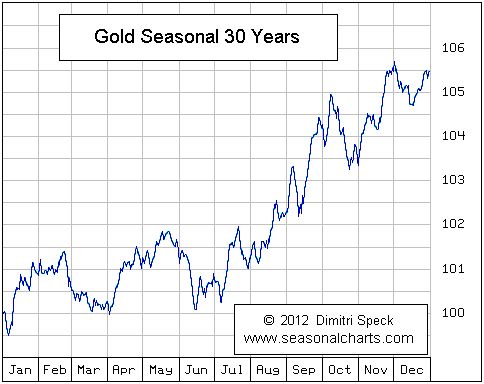
 This chart courtesy www.seasonalcharts.com shows the historical trend of the price of gold, based on 30 years of data. Once the doldrums of June and July are out of the way, price usually rises until January-February. The challenge is to catch the June lows.
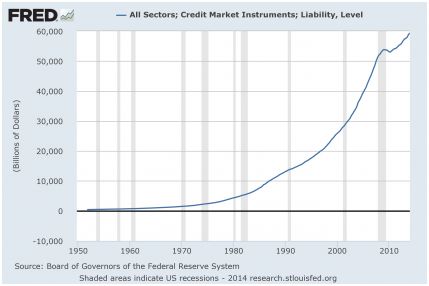
This chart courtesy Federal Reserve Bank of St. Louis shows the total amount of debt in the USA is now 60 trillion dollars. This cannot possibly be paid off, and it will be inflated away. Gold and silver will benefit.
"Gold, unlike all other commodities, is a currency...and the major thrust in the demand for gold is not for jewelry. It’s not for anything other than an escape from what is perceived to be a fiat money system, paper money, that seems to be deteriorating."
-– Alan Greenspan, ex-US Federal Reserve Chairman, August 23, 2011
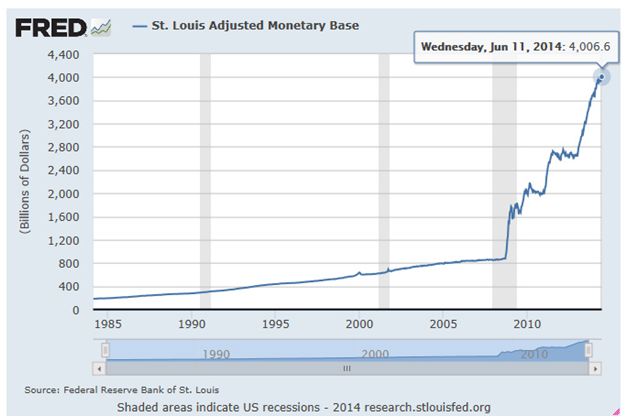
This chart is also courtesy Federal Reserve Bank of St. Louis. The chart shows the Base having just topped the 4 trillion dollar level, and it does not reflect any ‘tapering’! Instead it shows the US Monetary Base has increased from 800 billion dollars to over 4 trillion dollars in just 5 years. This new money has inflated the bond market and the stock market, and soon a lot of this money will find its way into the precious metals sector, as price inflation motivates investors to seek protection from ‘asset destruction’.
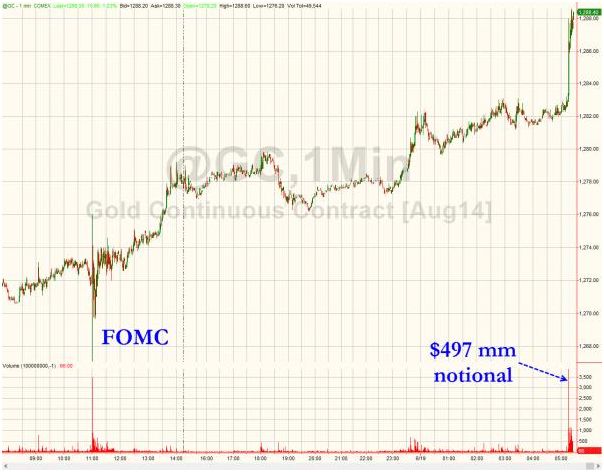
This chart courtesy www.zerohedge.com shows someone making a gold purchase of almost half a billion dollars early on Thursday June 19th. Sometimes ‘they do ring a bell!’
"It is a sobering fact that the prominence of central banks in this century has coincided with a general tendency towards more inflation, not less. [I]f the overriding objective is price stability, we did better with the nineteenth-century gold standard and passive central banks, with currency boards, or even with ‘free banking.’ The truly unique power of a central bank, after all, is the power to create money, and ultimately the power to create is the power to destroy."
-- Paul Volcker, ex Federal Reserve Chairman (in the Foreword of "The Central Banks")
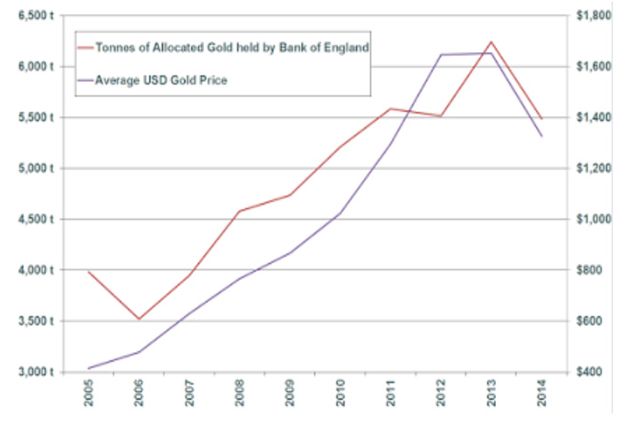
This chart courtesy www.Ingoldwetrust.ch shows custodial gold stored at the Bank of England fell by 755 tonnes in 2013. This proves the demand for physical gold is greater than mine supply can meet.
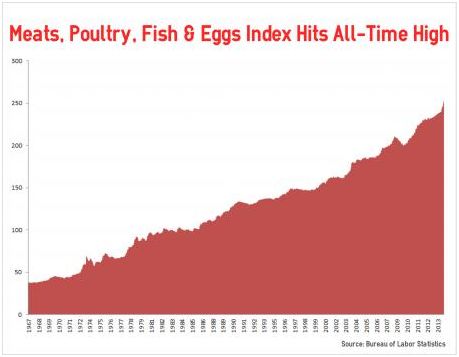
This chart courtesy BLS and CNSNews.com shows the food index at BLS has just reached a new all-time high at 252.8. The index rose 7.7% during the past 12 months.
"Gold still represents the ultimate form of payment in the world. Fiat money in extremis is accepted by nobody. Gold is always accepted."
-- Alan Greenspan, May 20, 1999
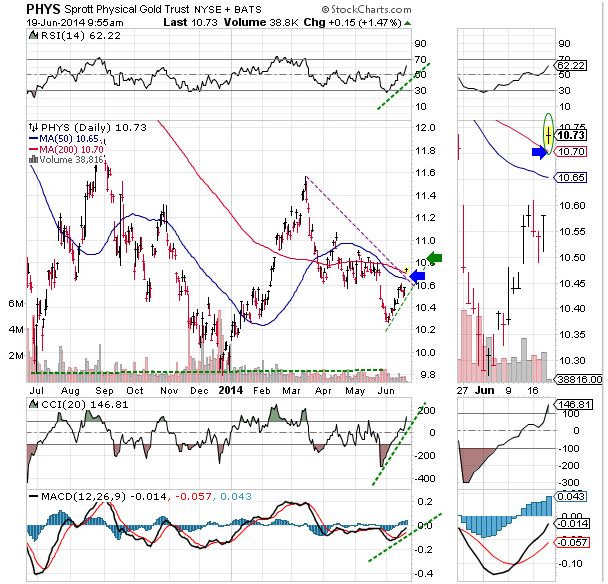
This chart courtesy Stockcharts.com features PHYS the Sprott gold trust. Price is breaking out at the moving averages. A close above the green arrow will turn the trend bullish. The 3 supporting indicators are positive.
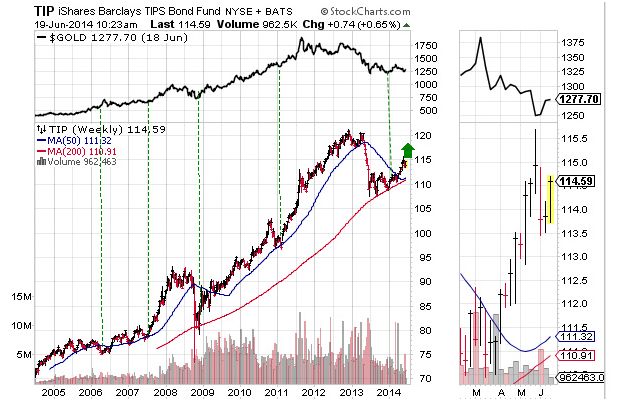
This chart courtesy Stockcharts.com shows TIP the bond fund that is indexed to inflation. Investors in TIP seem to know when price inflation is on the horizon. Historically, whenever TIP breaks out after a pullback (as now), the price of gold (top of chart) begins to rise! Once again TIP is setting the example for gold to follow.
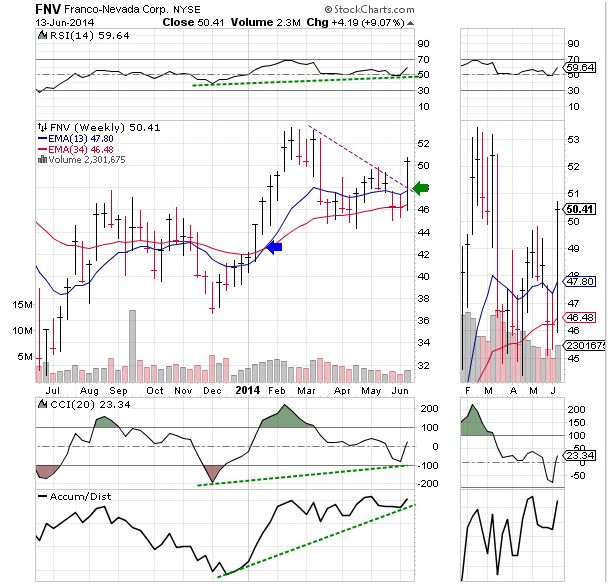
Featured is the weekly Franco-Nevada chart. In January we drew attention to the fact that the 13 week exponential moving average had crossed over and risen above the 34 WEMA, thereby issuing a buy signal. Last week price broke out above the 3 month old downtrend line, while the two moving averages remained in positive alignment. This is a very bullish signal. The supporting indicators (SIs) are positive, including the A/D line which turned up even before the January buy signal. Since FNV is a royalty company, it is useful as a leading indicator for the mining industry.
"Governments lie; bankers lie; even auditors sometimes lie: gold tells the truth."
-- Lord Rees Mogg, economist & former editor of The Times
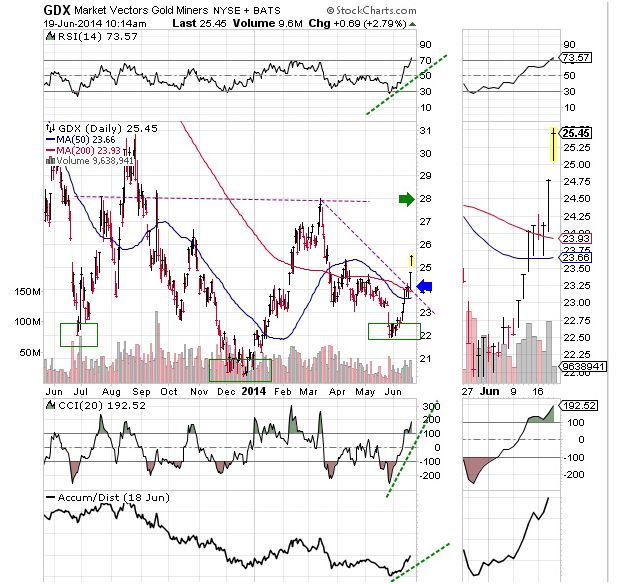
This chart courtesy Stockcharts.com shows GDX the gold and silver producers ETF has broken out at the downtrend lines. The supporting indicators are positive, including the important A/D line. We await the breakout at the green arrow. This will confirm an ‘inverted head and shoulders’ pattern, with a target at 36!
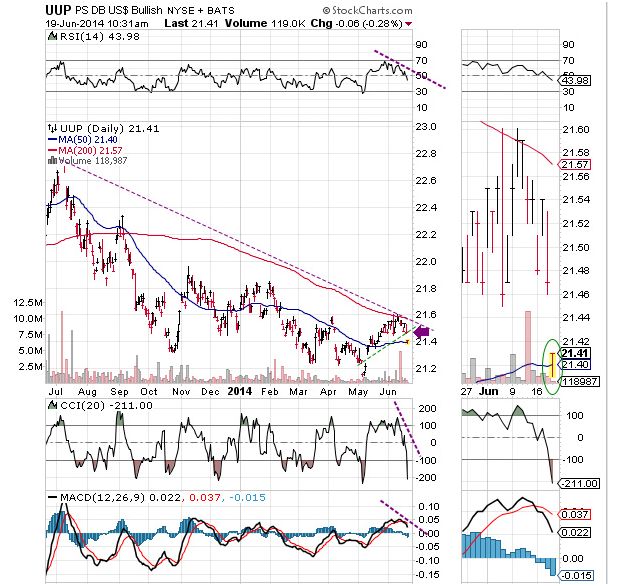
This chart courtesy Stockcharts.com shows the US dollar ETF is dropping below the most recent support line. The supporting indicators are negative. Almost always, the US dollar index moves in the opposite direction to gold and silver.
"Like gold, U.S. dollars have value only to the extent that they are strictly limited in supply. But the U.S. government has a technology, called a printing press (or, today, its electronic equivalent), that allows it to produce as many U.S. dollars as it wishes at essentially no cost. By increasing the number of U.S. dollars in circulation, or even by credibly threatening to do so, the U.S. government can also reduce the value of a dollar in terms of goods and services, which is equivalent to raising the prices in dollars of those goods and services."
-- Ben Bernanke, the former Chairman of the Board of Governors of the Federal Reserve Bank of the United States, in a speech he made on November 21, 2002 before the National Economists Club in Washington, D.C.
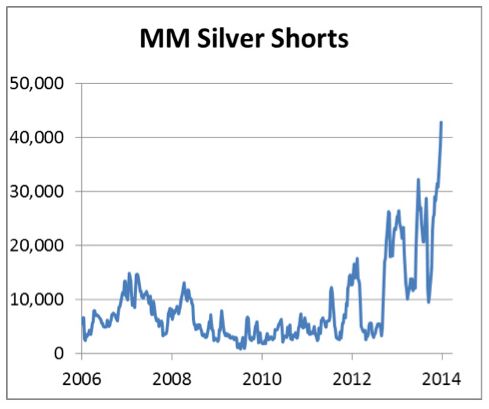
This chart courtesy www.goldmoney.com shows 'managed money' (mostly hedge funds), is short the largest number of contracts since at least 2006. These positions have to be covered, when the price of silver begins to rise. From a contrarian perspective this is a very bullish chart.
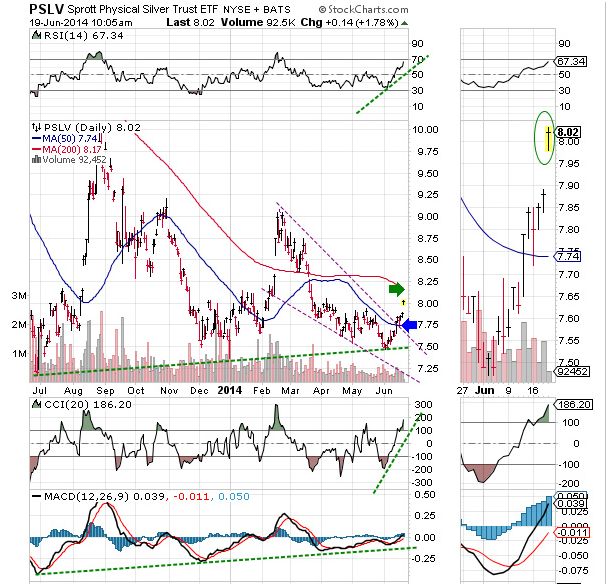
Featured is PSLV the Sprott silver trust. Price is breaking out at the bullish falling wedge pattern. A close above the green arrow will turn the trend bullish. The 3 supporting indicators are positive. The premium over bullion is a positive +2.0%.
Our thanks to www.nowandfutures.com for the quotes used in this article.
Happy trading!
By Peter Degraaf
Peter Degraaf is an on-line stock trader with over 50 years of investing experience. He issues a weekend report on the markets for his many subscribers. For a sample issue send him an E-mail at itiswell@cogeco.net , or visit his website at www.pdegraaf.com where you will find many long-term charts, as well as an interesting collection of Worthwhile Quotes that make for fascinating reading.
© 2013 Copyright Peter Degraaf - All Rights Reserved
DISCLAIMER:Please do your own due diligence. Investing involves taking risks. I am not responsible for your investment decisions.
Peter Degraaf Archive |
© 2005-2022 http://www.MarketOracle.co.uk - The Market Oracle is a FREE Daily Financial Markets Analysis & Forecasting online publication.