


Crude Oil - US Dollar Divergence
Currencies / US Dollar May 06, 2008 - 01:12 PM GMTBy: Black_Swan

 We got a fairly decent level of angst mail yesterday, in relation to the series of charts John Ross put together, suggesting maybe the market is telling us the buck has bottomed. Some of the usual conspiracy kooks and some very real and solid reasons why the buck will make new lows again were included in our email box. Thank you to all for your feedback. We always appreciate it and learn from it.
One of our readers asked the following excellent question: “[B]ut how to explain dollar/oil to the crowd following that correlation?”
We don’t really have a good reason. We could share a few maybes:
1) Maybe the Gulf States believe the buck has bottomed and are less willing to exchange excess dollars into pounds and euro at the same rate they’ve done in the recent past.
2) Maybe the fact that the US consumer has not completely cratered (at least not yet) laboring under $100-plus oil prices has aroused some confidence in the economy.
3) Maybe it’s simply a near-term divergence that will be closed when the dollar tests its all-time new low again.
4) Maybe crude oil is close to peaking, at least for the intermediate-term.
As you can see, our maybe list is neither vast nor impressive. Maybe that’s why we look at charts. At times they may be telling us there is a lot more going on under the surface than we understand. That we know is true.
Crude vs. US$ Index (inverted) on the next page
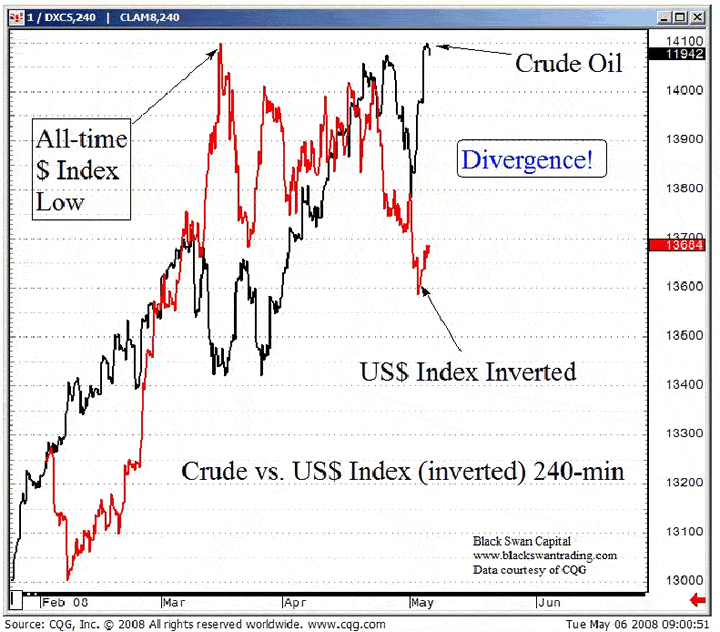
Note: The $ Index inverted (red line) is used so you can see the correlation. As the $ Index inverted line goes higher, it means the US dollar is going lower relative to the other currencies. Note the all-time low posted on the chart for the dollar back on March 17th. Of course the new all-time high in crude was last night EST or today if you live east of us.
Jack Crooks
Black Swan Capital LLC
http://www.blackswantrading.com/
Black Swan Capital's Currency Snapshot is strictly an informational publication and does not provide individual, customized investment advice. The money you allocate to futures or forex should be strictly the money you can afford to risk. Detailed disclaimer can be found at http://www.blackswantrading.com/disclaimer.html
Currency Currents is available for only $49 per year. Just visit the sign-up page on our website to subscribe: http://www.blackswantrading.com/Currency_Currents.html
Black Swan Archive |
© 2005-2022 http://www.MarketOracle.co.uk - The Market Oracle is a FREE Daily Financial Markets Analysis & Forecasting online publication.