Global and UK House Prices
Housing-Market / UK Housing Jun 16, 2014 - 07:20 PM GMTBy: Jonathan_Davis
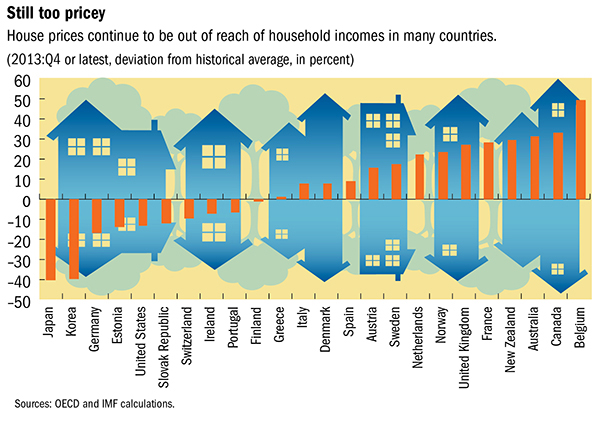
 The charts below show global house prices in relation to local incomes and historic rents. Some of the prices are shockingly high, relative to reasonable economic comparators.
This first one, shows prices to incomes. To explain the chart, Italian house prices are seen as about the same, historically, relative to current income levels.
Whereas UK house prices, for example, are seen as c 30% over the long term norm in relation to incomes. Japan’s real estate prices are significantly lower than you would normally expect given income levels.
In the next chart prices are compared to prevailing rent levels. Almost the same countries have over or under priced conclusions attached to them.
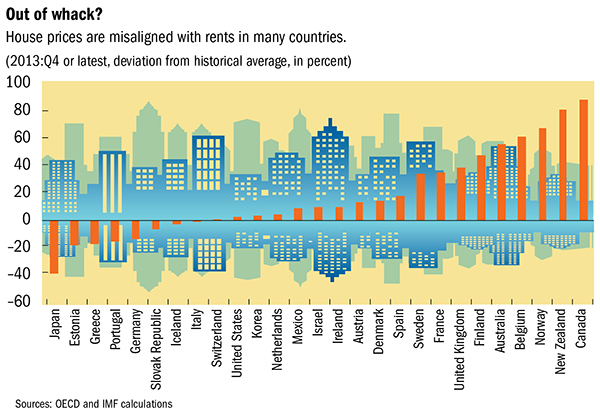
Notably, according to the Organisation for Economic Cooperation and Development and the International Monetary Fund, the UK’s house prices are even higher, relative to rents, than to incomes.
Either, in their analyses, this is because rents will rise to compensate or house prices will fall, eventually, to compensate.
It appears that, according to them, Australia and Canada – broadly similar economies to that of the UK – are, like the UK, in great danger of entering economic depression, in due course. I am in good company there as, when I suggest that, the Governor of the Bank of England has said as much in recent pronouncements. France, too. Of course, much of the EU is already in Depression.
Let us consider.
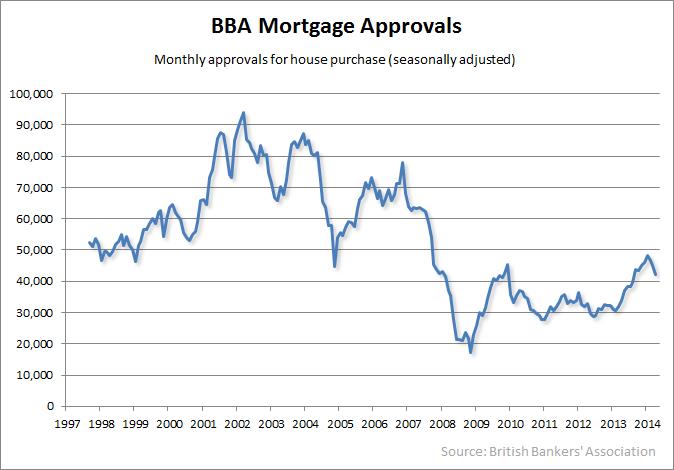
The next chart shows the number of mortgages at approval stage by the members of the British Bankers Asscociation.
As you can see the number is significantly below that of the peak in prices in 2007 and way below peak lending 5 years prior to that. Evidently, prices can rise with lower volumes. And that is how it normally is. Stella McCartney sells 1 dress at £25,000. John Lewis sells 5000 at £200 etc. Of course, when even Ms McC has to reduce prices you can bet your bottom dollar so is everyone below her.
Of course, prices have risen as volumes have fallen. That will not always be the case. Eventually, buyers will disappear and prices will fall as they quite simply can go no higher, without new buyers. We also see that, recently, approval numbers have fallen. The shape of things to come? On verra.
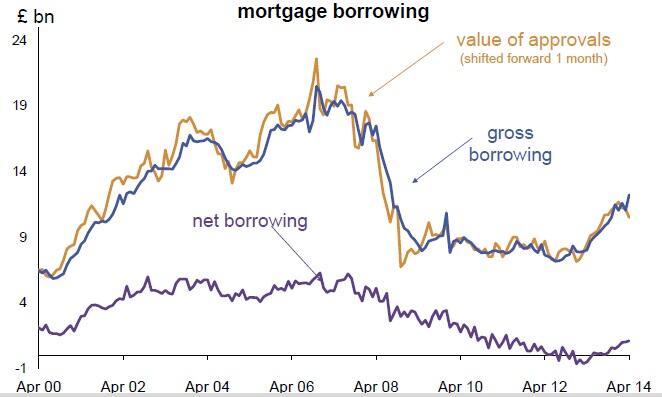
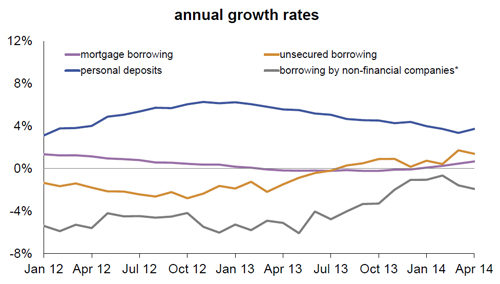
Next we see how gross borrowing has risen quite strongly – primarily due to Help to Buy (or as I call it now Help to Borrow). However, NET borrowings (after taking into account mortgage redemptions and reductions) are practically still on the floor at no growth or very tiny growth. This does not bode well for the housing market or prices.
And either does borrowing by non-financial companies (AKA the real economy), as shown in grey, below. Businesses are not borrowing and there has been a fall in lending to businesses for each of the last 3 years – not a reduction in the growth of lending, actual reductions in lending, annually. This is the REAL economy, not the financial/banking one. This is where house prices of ordinary mortals are. Not the multi million pound pads of the ultra rich.
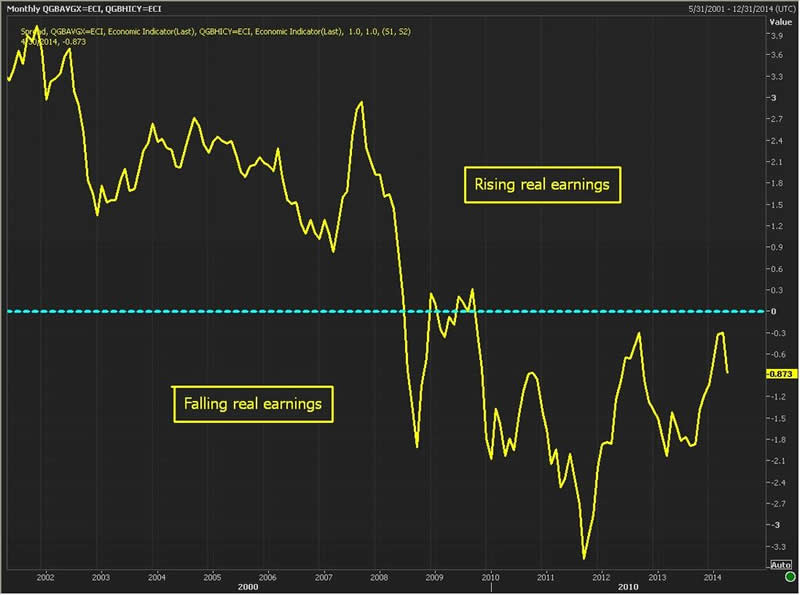
Consider this too, households’ incomes have not been keeping pace with the rises in the costs of living for 6 years. This, again, cannot bode well for house prices. The next chart shows incomes compared to CPI.
I’ll finish with a thought – one that I have expounded many times. The next time we have a global economic shock, which can be expected, the Bank of England cannot slash the Base Rate, as it has done every time it got us into difficulties in the past. The most they can cut is 0.5%. That will not make the blindest bit of difference to the real economy.
You conclude, based on the above, what is likely to happen to house prices. Let me know what you think.
By Jonathan Davis
http://jonathandaviswm.wordpress.com/
25+ year veteran of the world of financial services, the last 10 doing the same thing under his own name. We work with families all over the UK and in Switzerland and, indeed, on 2 other continents. If interested in our Wealth Management work, cast a glance at the firm’s website.
From time to time media folk call me and ask me to rant live or in the press. JD in the media.
I don’t buy hype. I don’t believe it’s the end of the world but I do believe, within a generation, the West will have no welfare state. The maths don’t lie. We’re toast. It’s obvious if you think about it.
© 2014 Copyright Jonathan Davis - All Rights Reserved
Disclaimer: The above is a matter of opinion provided for general information purposes only and is not intended as investment advice. Information and analysis above are derived from sources and utilising methods believed to be reliable, but we cannot accept responsibility for any losses you may incur as a result of this analysis. Individuals should consult with their personal financial advisors.
© 2005-2022 http://www.MarketOracle.co.uk - The Market Oracle is a FREE Daily Financial Markets Analysis & Forecasting online publication.


