


Stocks Bull Market 63 Months Old
Stock-Markets / Stock Markets 2014 Jun 07, 2014 - 05:48 PM GMTBy: Tony_Caldaro

 Another good week for stocks. The third week in a row the market has gained about 1%. The market displayed some choppiness early in the week, dealing with the OEW 1929 pivot. But then cleared it on Thursday, as it made new all time highs every day again except Tuesday. For the week the SPX/DOW gained 1.25%, the NDX/NAZ gained 1.75% and the DJ World index gained 1.35%. Economic reports for the week were mixed. On the uptick: ISM manufacturing/services, construction spending, factory orders, auto sales and consumer credit. On the downtick: the ADP, monthly payrolls, investor sentiment, the M1-multiplier, the WLEI, plus weekly jobless claims and the trade balance worsened. Next week we get reports on Retail sales, Export/Import prices and the PPI.
LONG TERM: bull market
The bull market of March 2009 continues. As this market enters its 63rd month it looks nothing like the 60 month, 2002-2007 bull market. That one basically started around the 1996 low and only managed to get about 1% above the 2000 all time high before it topped. That bull market was the end of a cycle. This bull market has been making all time new highs for over a year now. And, it certainly looks like the a new cycle wave: Cycle wave [1].
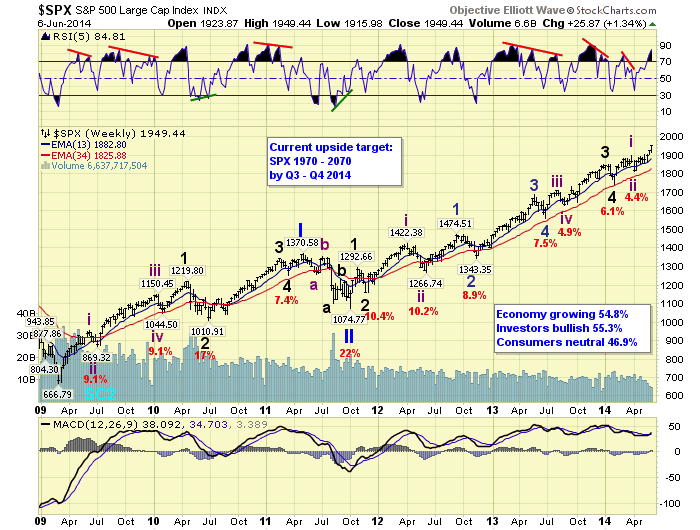
We have been counting this bull market as Cycle wave [1] since early 2010. Since Cycle waves unfold in five Primary waves we have been tracking it exactly that way. Primary waves I and II completed in 2011. Primary wave III has been underway since then. Primary I divided into five Major waves, with a subdividing Major wave 1. Primary III is also dividing into five Major waves. But after a simple Major wave 1, Major waves 3 and 5 have been subdividing. During Primary III, Major waves 1 and 2 ended in late 2011 and Major waves 3 and 4 ended in early 2014. Major wave 5 is currently still unfolding. When it concludes the market should experience its largest correction since 2011 for Primary wave IV. Then Primary V should take the bull market to even higher highs. Our target range for Q3/Q4 2014 remains SPX 1970 to 2070.
MEDIUM TERM: uptrend
This Intermediate wave iii uptrend began at SPX 1814 in mid-April. Its initial rally, Minor wave 1, lasted about one week. Then it went into a choppy sideways mode for four weeks. Many gave up on it, but we didn’t. We knew the NDX/NAZ had two more uptrends before completing their Primary wave III. And, they were the indices most heavily sold during the recent correction. While all this choppiness was unfolding we observed three potential counts. The most bullish one remained on the SPX charts, with two less bullish ones posted as alternates on the DOW charts. The least bullish of these two, and most popular, was eliminated this week. The DOW still has the potential of forming a diagonal triangle Major wave 5. Since it has only cleared its April high by less than 300 points.
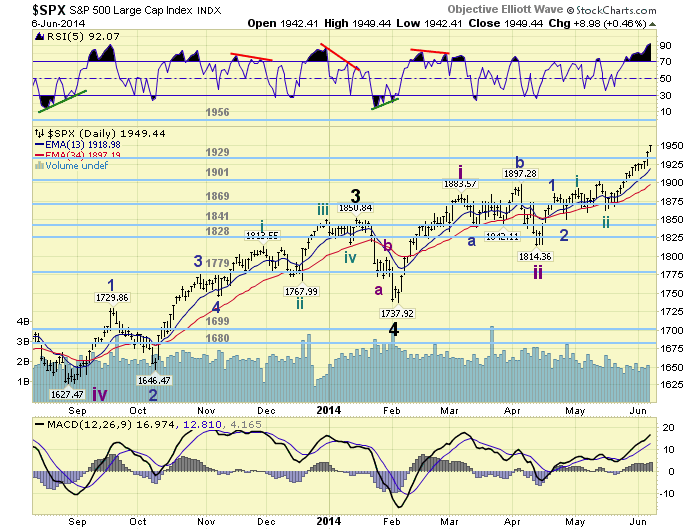
We continue to count this uptrend as Minor waves 1 and 2 completing at SPX 1885 and 1851. Minor wave 3 has been underway since that low. Minute waves i and ii completed at SPX 1891 and 1862, with Minute iii underway since that low. Minute iii has been subdividing into five Micro waves SPX: 1886-1868-1925-1916-1949. When Micro wave 5 concludes Minute wave iv should follow. Then a rising Minute wave v completes Minor 3, and a declining Minor 4 should follow. Finally the uptrend ends with a rising Minor 5. Medium term support is at the 1929 and 1901 pivots, with resistance a the 1956 and 1973 pivots.
SHORT TERM
Short term support is at the 1929 and 1901 pivots, with resistance at the 1956 and 1973 pivots. Short term momentum ended the week extremely overbought. The short term OEW charts are positive with the reversal level now SPX 1943.
As this market continues to make new highs nearly every day it is easy to get carried away with the rising tide. The easy part of this uptrend, if one could call it that, was the past three weeks. Three weeks ago, we knew the NAZ had to rally about 7% to near its bull market highs. Now it is about 1% away from that objective. In the meantime the SPX has already entered the range of our uptrend targeted 1956 pivot. Quite a run, yes. But this uptrend is extremely overbought on both the hourly and daily timeframes. And, the weekly timeframe has hit quite overbought.
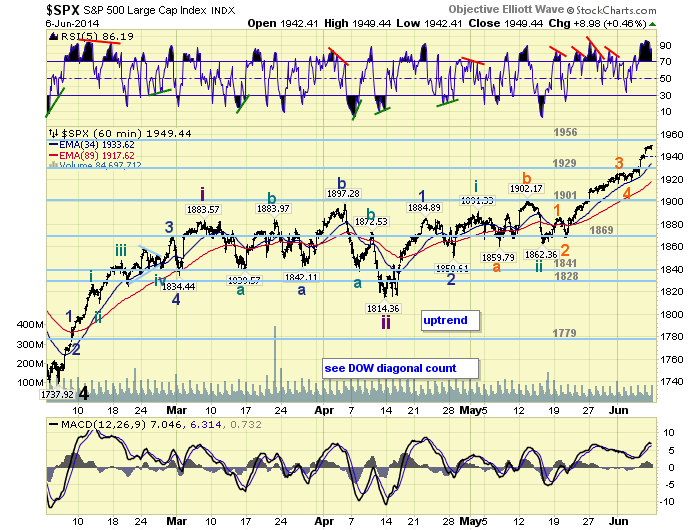
Overbought conditions like this usually lead, at some point, to a significant pullback. We just reviewed the Fibonacci relationships of the waves. We took into account not only the Micro, Minute and Minor waves of this uptrend. But the Intermediate waves of Major wave 5, the Major waves of Primary III, and compared Primary III to Primary I as well. We arrived at two important price clusters just ahead: SPX 1954-1958 and SPX 1966-1973. Both of these clusters fit quite nicely with the 1956 and 1973 pivots.
We conclude that Micro 5/Minute iii should end within the range of the 1956 pivot. Then after a Minute iv pullback, possibly to the 1929 pivot range, Minute v/Minor 3 should end within the range of the 1956 or 1973 pivot. So it does appear some volatility is ahead as this uptrend concludes. Best to your trading next week!
FOREIGN MARKETS
The Asian markets were mostly higher for a net gain of 1.0%.
The European markets were mostly higher for a net gain of 2.1%.
The Commodity equity group were all higher for a net gain of 3.3%.
The DJ World index continues it uptrend gaining 1.35%.
COMMODITIES
Bonds appear to be down trending and lost 0.8% on the week.
Crude continues to downtrend and lost 0.1% on the week.
Gold remains in a downtrend but gained 0.2% on the week.
The USD is still uptrending but finished flat on the week.
NEXT WEEK
Tuesday: Wholesale inventories. Wednesday: the Treasury deficit. Thursday: weekly Jobless claims, Retail sales, Export/Import prices and Business inventories. Friday: the PPI and Consumer sentiment. The FED has one activity scheduled. Monday at 12:45 FED governor Tarullo gives a speech. Best to your weekend and week!
CHARTS: http://stockcharts.com/public/1269446/tenpp
http://caldaroew.spaces.live.com
After about 40 years of investing in the markets one learns that the markets are constantly changing, not only in price, but in what drives the markets. In the 1960s, the Nifty Fifty were the leaders of the stock market. In the 1970s, stock selection using Technical Analysis was important, as the market stayed with a trading range for the entire decade. In the 1980s, the market finally broke out of it doldrums, as the DOW broke through 1100 in 1982, and launched the greatest bull market on record.
Sharing is an important aspect of a life. Over 100 people have joined our group, from all walks of life, covering twenty three countries across the globe. It's been the most fun I have ever had in the market. Sharing uncommon knowledge, with investors. In hope of aiding them in finding their financial independence.
Copyright © 2014 Tony Caldaro - All Rights Reserved Disclaimer: The above is a matter of opinion provided for general information purposes only and is not intended as investment advice. Information and analysis above are derived from sources and utilising methods believed to be reliable, but we cannot accept responsibility for any losses you may incur as a result of this analysis. Individuals should consult with their personal financial advisors.
Tony Caldaro Archive |
© 2005-2022 http://www.MarketOracle.co.uk - The Market Oracle is a FREE Daily Financial Markets Analysis & Forecasting online publication.