


Equities Over Optimistic Earnings Estimates as US Heads for Recession
Stock-Markets / Stock Market Valuations May 04, 2008 - 02:37 PM GMT

 Words from the (investment) wise - Part 1
USA Today: Warren Buffett – Economy in a recession, will be worse than feared
“Warren Buffett, the world's richest person, said Monday that the US economy is in a recession that will be more severe than most people expect.
“‘This is not a field of specialty for me, but my general feeling is that the recession will be longer and deeper than most people think,' Buffett said. ‘This will not be short and shallow.'
“‘I think consumers are feeling gas and food prices,' he added, ‘and not feeling they've got a lot of money for other things.'
“‘In the retail businesses … if anything, they've gotten a little worse,' Buffett said. ‘Of course, things connected with housing, whether it's in brick or whether it's in carpet, those businesses have shown no uptick at all. Jewelry had a bad Christmas … and it stayed that way.'
“Buffett sees no respite from the housing slump. ‘I think this is going to be fairly long and fairly deep, but who knows,' he said.”
Source: USA Today , 29 April 2008.
CNBC: Nouriel Roubini – Alphabet soup of US recession
Source: CNBC , April 25, 2008.
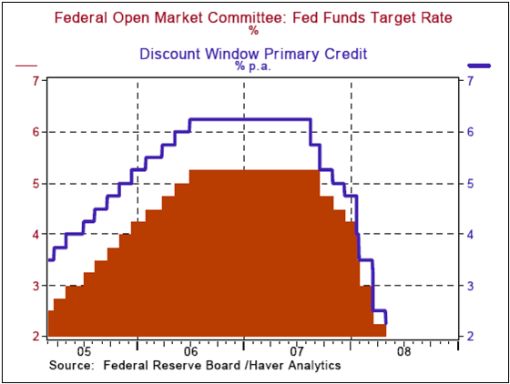
Asha Bangalore (Northern Trust): Fed is ready to watch and wait
“The Federal Reserve lowered the Federal funds rate 25 bps to 2.00% and reduced the discount rate 25 bps to 2.25%. The Fed is ready to watch and wait. There were broad hints than the June24 to 25 meeting is likely to close with no change in the Federal funds rate.
“With respect to economic growth the FOMC policy statement now reads as ‘recent information indicates that economic activity remains weak.' This represents a Fed that is less pessimistic about growth because the March policy statement observed that ‘recent information indicates that the outlook for economic activity has weakened further.'
“The FOMC's evaluation of the housing sector and financial market conditions has not changed; the policy statement retained the March description that ‘financial markets remain under considerable stress, and tight credit conditions and the deepening housing contraction are likely to weigh on economic growth over the next few quarters.'
“There was a subtle change in the manner in which the FOMC views consumer spending. Today's statement reads as ‘household and business spending has been subdued' whereas in March the statement focused only on consumer spending and noted that the growth of consumer spending has slowed.
“Today's statement notes that ‘labor market conditions have softened further,' compared with the March observation that ‘labor markets have softened.' This is consistent with the increase in the March unemployment rate to 5.1% from 4.9% in February.
“The policy statement today is noticeably less hawkish about inflation compared with the March 18 statement. Inflation is expected to moderate due to lower resource utilization and a leveling off of energy and commodity prices. The key is in the change regarding the outlook for inflation. Today, the FOMC noted that ‘uncertainty about the inflation outlook remains high,' but in March the statement read as ‘uncertainty about the inflation outlook has increased.'
“The last paragraph of the policy statement shows a noteworthy modification. The grim observation that ‘downside risks to growth remain' of the March policy statement is not featured in today's policy statement. Instead, the closing part of the statement opens with the remark ‘substantial easing of monetary policy to date,' which translates to enough has been done. In other words, the FOMC would prefer to wait and see the impact of the 325 basis point cut in the federal funds rate and the other programs it has put in place.”
Source: Asha Bangalore, Northern Trust - Daily Global Commentary , April 30, 2008.
Asha Bangalore (Northern Trust): US economy stalling for second quarter in a row
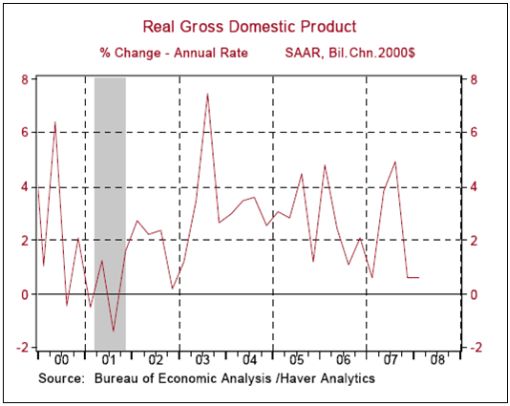
Source: Asha Bangalore, Northern Trust - Daily Global Commentary , April 30, 2008.
David Rosenberg (Merrill Lynch): GDP report has a recession feel
“The [GDP] report definitely has a recession feel to it.
1) Real per capital national income is now in decline. This was the second quarter in a row of a +0.6% print on real GDP. With population growth running at +1% annually, it means that real per capita national income is now in decline …
2) Home-grown economic backdrop is very soft. The key measure of domestic economic activity is real final sales to domestic purchasers, which is real GDP excluding inventories and net foreign trade. This metric actually shrank at a 0.4% annual rate in the first quarter (it had already slowed to a meagre 1.3% annual rate in the fourth quarter from 2.5% in the third). Note that this indicator never contracted in the 2001 recession – in other words, as bad as it was back then, today's home-grown economic backdrop is softer than it was in that cycle (a cycle that ultimately saw the S&P 500 sink nearly 50% and the Fed cut the funds rate to 1%). You have to go back to the tail end of the 1991 recession to see the last time real final sales to domestic purchasers was as weak as it is now, and rare is the time that this metric goes negative without the overall economy being in a recessionary state.
3) Prior pillars of strength starting to feel the pinch. In terms of sectors, the prior drags on GDP are getting even worse. Residential construction slumped at a huge 26.7% annual rate and this followed the 25.2% slide in last year's fourth quarter – not since the dark days of the 1981 recession has housing been so weak. And, given the fact that the aggregate unsold vacant housing inventory surged at a 20% annual rate in the first quarter to a record 2.3 million units, further contraction is coming in this sector (it was this time last year that the consensus and the Fed were telling us that housing was not going to be a drag on GDP in 2008). At the same time, the prior pillars of strength are starting to feel the pinch.”
Source: David Rosenberg, Merrill Lynch (via The King Report ), April 30, 2008.
Bloomberg: Stephen Roach sees negative growth in US for second quarter
Source: Bloomberg , April 30, 2008.
Bloomberg: Henry Paulson – US “closer to the end” of credit crisis

Source: Bloomberg , April 30, 2008.
John Williams (Shadow Government Statistics): GDP overstated
“Gross Domestic Income Contracted 1.0% in the Fourth Quarter. Gross Domestic Income (GDI) is the income-side equivalent to the GDP's consumption-side measure. As in double-entry bookkeeping, both sides should equal each other, with both measures showing the same rates of growth. Such rarely is the case, however, and sometimes the pattern of differences between the two series is suggestive of more than simple reporting inconsistencies. The differences between the two series are resolved mathematically by adding a statistical discrepancy account to the income side, and the discrepancies have been soaring.
“The amount of discrepancy (not adjusted for inflation) moved from a negative $40.8 billion in second quarter 2007, to a positive $84.8 in the third quarter, to a positive $139.9 billion in the fourth quarter. The positive discrepancy means that GDP is being overstated relative to GDI.
“As a result, where third- and fourth-quarter real (inflation-adjusted) growth rates were 4.9% and 0.6% for the GDP, the GDI saw a growth rate of just 1.2% in the third quarter and a contraction of 1.0% in the fourth quarter. Both sets of numbers are supposed be legitimate, but the GDI is showing the economy already to be in contraction.”
Source: John Williams, Shadow Government Statistics (via The King Report ), April 30, 2008.
NBER: Defining a recession
“The NBER does not define a recession in terms of two consecutive quarters of decline in real GDP. Rather, a recession is a significant decline in economic activity spread across the economy, lasting more than a few months, normally visible in real GDP, real income, employment, industrial production, and wholesale-retail sales.”
Source: NBER (via The King Report ), April 30, 2008.
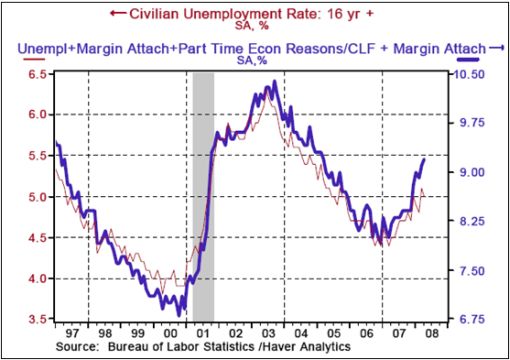
Asha Bangalore (Northern Trust) Employment details more pessimistic than headlines
“ Civilian Unemployment Rate : 5.0% in April versus 5.1% in March.
Payroll Employment : -20,000 in April versus -81,000 in March, net loss of 8,000 jobs after revisions of payroll estimates for February and March.
Hourly earnings : +1% to $17.88, 3.4% yoy change versus 3.65% yoy change in March; cycle high was 4.28% yoy change in December 2006.
“Moving on to the details, it is typical to find that part-time employment for economic reasons and marginally attached workers are increasing. In April, part-time employment for economic reasons rose 20.6% from a year ago. Alternatively, this situation can be seen as an increase in part-time employment to 5.22 million versus 4.37 million employees a year ago. The BLS also publishes information about marginally attached persons to the labor force. These folks are either discouraged workers or they want to work and are available but are not working and have looked for work in the recent past. If we sum the number of officially unemployed, the number of marginally attached workers, and the number of working part-time for economic reasons we obtain a more comprehensive measure of unemployment. This broader measure of unemployment rose to 9.2% in April which is significantly higher than the 8.2% rate reported in April 2007.”
Source: Asha Bangalore, Northern Trust - Daily Global Commentary , April 30, 2008.
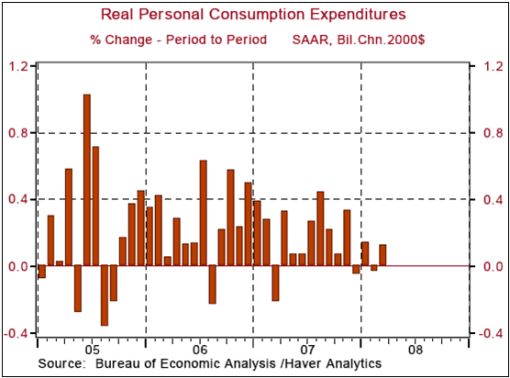
Asha Bangalore (Northern Trust): Soft trajectory for consumer spending
“Personal income grew 0.3% in March after a 0.5% increase February. Nominal consumer spending rose 0.4% during March but after adjusting for inflation consumer spending was up only 0.1%. … consumer spending has barely advanced in the four months ended March. Weak employment conditions, a financially strapped consumer and a reduction in mortgage equity withdrawals, due to declines in homes prices, should result in a soft trajectory for consumer spending for several months ahead. Personal saving as a percentage of disposable income was 0.2% in March, following a 0.4% reading in February.”
Source: Asha Bangalore, Northern Trust - Daily Global Commentary , May 1, 2008.
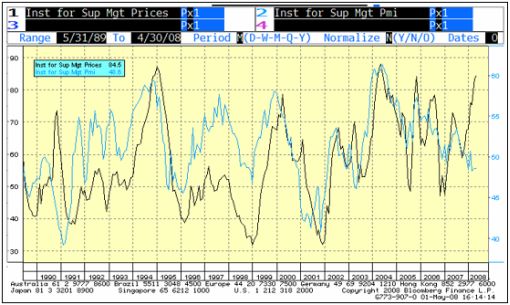
Bill King (The King Report): ISM versus Prices Paid
“The ISM versus Prices Paid chart below illustrates the inflationary recession that is now occurring. Usually Prices Paid fall with the ISM but now they are starkly diverging.”
Source: Bill King, The King Report , May 2, 2008.
Standard & Poor's: S&P/Case-Shiller Home Price Indices – declines continuing
“Data through February 2008, released today by Standard & Poor's for its S&P/Case-Shiller Home Price Indices, the leading measure of US home prices, show declines in the prices of existing single family homes across the United States worsened in the second month of the new year …
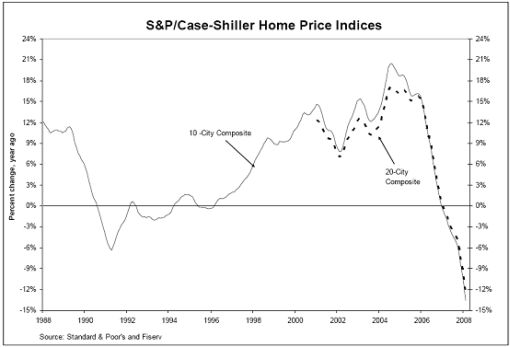
“The chart above depicts the annual returns of the 10-City Composite and the 20-City Composite Indices. Both of the composite indices are now reporting annual declines in excess of 12.5%. The 10-City Composite posted a new record low annual decline of 13.6%, and the 20-City Composite recorded an annual decline of 12.7%.
“‘There is no sign of a bottom in the numbers,' says David Blitzer, Chairman of the Index Committee at Standard & Poor's.”
Source: Standard & Poor's , April 29, 2008.
Bloomberg: KB Home's Broad – home prices may drop another 20%

Source: Bloomberg , April 28, 2008.
Financial Times: Rising defaults hit Countrywide
“Results from Countrywide Financial and MasterCard on Tuesday underscored the declining state of the US economy as mortgage defaults soared and more consumers turned to credit cards for basic purchases.
“Countrywide, the largest US mortgage lender, said it lost a larger-than-expected $893 million in the first quarter as provisions for credit losses jumped ten-fold to $1.5 billion and charge-offs on bad loans rose to $606 million from $39 million.
“BofA expects to close the acquisition in the third quarter and has pledged to aid Countrywide borrowers in danger of losing their homes as their interest rates reset to higher levels.
“MasterCard on Tuesday said first-quarter profits more than doubled to $447 million, or $3.38 per share, as US consumers put more expenses such as food and petrol on their cards.
“Taken together, the results demonstrate the heavy pressure weighing on US consumers as the value of their home falls and the price of petrol, goods and other items soars.”
Source: Ben White, Financial Times , April 29, 2008.
Financial Times: Hopes of a financial rally hit bonds
“April has been the cruelest month for government bond markets in years, with prices falling and interest rates rising sharply in the US, Europe and Japan.
“The sell-off appears to be related to growing optimism about the financial system, as investors who had sought the safety of government debt amid fears about bank failures now put more money into stocks.
“Higher rates could also reflect fears about inflation triggered by the sharp rise in food and energy prices.
“A global index of government bonds from 33 countries compiled by Lehman Brothers has fallen 3% this month, its first decline since December and the worst performance since a fall of 4.3% four years ago.
“Lehman's US Treasury index has fallen 2.1% this month, its worst performance since April 2004, while the S&P has rallied 5.7% in April.
“‘Flight to quality buying took Treasury yields well below fundamental value …,” said Jay Mueller, portfolio manager at Wells Capital Management. ‘Now people think the Fed is about done.'”
Source: Michael Mackenzie, Financial Times , April 25, 2008.
Jeremy Grantham (GMO): Equities – what is going on?
“Look at the amazing earnings estimates for the S&P 500! On January 1 the first quarter estimate was +12%. It is now -8%. Was the credit crisis still hiding on January 1? Even now the forecast for this year is +15%. Plus 15%! What is going on?
“With denial skills of this magnitude it is surely not a surprise that subtleties within the equity market such as quality versus junk have been misjudged. But in the end reality usually wins out and the outlook for the riskier end of US stocks is ugly indeed. They are vulnerable on three fronts.
“First, a credit crisis: on corporate accounting there is no vulnerability in the highest quartile of quality and little in the next half. All the vulnerability is concentrated in the bottom quartile by quality. These lower quality companies have used increased leverage and some are very vulnerable, although the largest vulnerability of all is in smaller companies below the S&P 500.
“Second, profit margins: the profitability of smaller and more marginal companies ebbs and flows relative to the S&P on a multiyear cycle. When you have a long, drawn out economic cycle, particularly one characterized by a sustained series of pleasant surprises like this one, capacity will be tighter and secondary suppliers, the more marginal companies, will especially thrive.
“The third vulnerability is in price/earnings ratios. … the market has never gotten the need to normalize for good times. Periods of above average margin should be expected to have below average P/E, but not a whisper of this is to be heard. The correlation between margins and P/E is +.32. It doesn't even have the right sign. And this has been a classic case where secondary, low-quality companies that have fundamentally thrived in this extended boom ended up with both peak margins and a premium P/E.
“Because of this past favorable set of circumstances, the low-quality companies are exposed to a triple threat: their absolute and relative margins decline; their P/Es fall relative to the market, multiplying their pain; and they are far more exposed than average to a severe credit crisis.
“Yet another demonstration of the extraordinary resilience (or denial) in US equity markets is shown in their outperformance of foreign equity markets. Many local economies are hanging tough, and not just in emerging countries. Germany and France for two are both looking resilient, at least for now. But they all have serious stock market concerns about US economic weakness and the US credit crisis. On worries over US problems, their markets have declined more than ours has, although our market sits at the very heart of the problem. Quite remarkable!”
Click here for the full report.
Source: Jeremy Grantham's Quarterly Letter, GMO , April 2008.
Larry Jones (Nedgroup Investment Advisors): US equity market valuations – where to from here?
“Were the sharp equity market falls justified and, can current US equity market valuations shed any light on potential market direction from here?
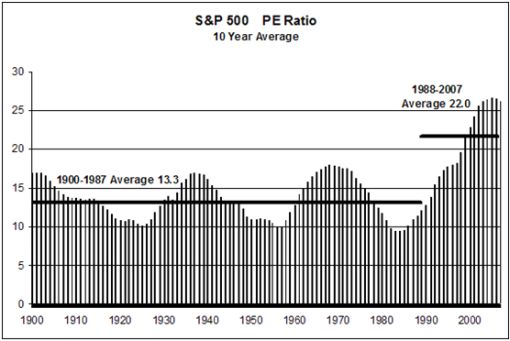
“As of this writing the S&P 500 Index is trading at a Price–Earnings (PE) Ratio of 20 times, trailing 12-month earnings. Despite the recent market decline, the market PE is still well above its historic average. The average PE ratio for the market from 1900 through to 2007 is 14.9 times. However, such a snapshot market valuation can be of limited use.
“US corporate earnings are cyclical and it matters very much where in the cycle we are as to whether the current multiple represents good value or not. For example, at the bottom of the last recession in 2002, the market was trading at a PE multiple of more than 40 times (depressed) earnings. Despite the high multiple, this was actually a buying opportunity. At that time the market was looking through the recession toward the profit rebound which was likely to occur. Over the five years from October 2002, earnings more than doubled and the stock market was higher by 80%.
“Earnings for the S&P 500 companies peaked in mid-2007 at about $85 per share but have now fallen to below $70 per share. Thus, the market PE of 20.5 (on trailing 12 months earnings) is higher now than it was in July of 2007, despite the market having fallen 12%. Corporate earnings may also have further to fall, given that US consumer spending accounts for 70% of GDP and the full effect of the housing recession probably has yet to feed through to the wider economy.
“At some point the market will begin to anticipate an earnings recovery in this cycle as well. Reference to a static PE ratio for the market will not help us identify a turning point. A method of correcting for cyclical peaks and troughs in earnings is to look at a ten-year average of PE ratios. The accompanying chart plots this average from 1900 to the present. It reveals the high level of equity valuations, which have prevailed over the past twenty years. Through 1987 the market PE averaged 13.3. Over the twenty years since, the market PE has averaged 22.0. To some extent, the higher recent multiples have been justified by the sustained disinflation experienced over the period. History shows that periods of falling inflation (and falling bond yields) have been associated with rising PE multiples.
“However, it is not clear that the environment going forward will be benign. Global inflation rates seem to be ticking higher. U S ten-year bond yields at 3.50% are currently quite low and not discounting the risk of potential higher inflation. Over the next few years, should higher inflationary pressures lead to rising bond yields, this would probably usher in a period of contracting PE multiples. Such a scenario may not come to pass, or may take some time to unfold. But the prospect of this risk in conjunction with the relatively high levels of valuation going into this recession means that the market may disappoint those investors looking for a resumption of outsized equity market returns following this economic slowdown.”
Source: Larry Jones, Nedgroup Investment Advisors, April 23, 2008.
Richard Russell (Dow Theory Letters): Stock market will sniff out forthcoming trouble
“There's no question about it, this recession or whatever you want to call it, is starting to bite. It's got the whole country nervous and worried. ‘For sale' and ‘for lease' signs are springing up across the land.
“For many young workers, it's the first time they've ever dealt with layoffs. If you haven't received a pink slip, then it's your fellow worker or your neighbor who's been given a lay-off notice. For much of America, this is frightening. And then there are all those foreclosures – empty houses on your street are hardly confidence-builders.
“But the stock market is well aware of all this. The stock market knows more about unemployment and hard times than all of America's labor leaders and employment experts taken together and including the Department of Labor.
“The market saw today's tough times coming back in July of 2007 when the D-J Transportation Average topped out. And later in January, the market looked ahead and discounted the worst. After January 17, the technical condition of the market began to improve. At first, the improvement was subtle, almost imperceptible to nontechnical minded people. Then during March and April, the improvement in market action became more visible. This is where we are now.
“And I keep scrutinizing the stock market for any indications of weakness. If there's trouble ahead, if the market senses a worsening economy, six months or even a year from now, it will start reflecting the situation. The stock market will sniff out forthcoming trouble the way an antelope senses a lion that's lying in wait for it just 50 yards away.”
Source: Richard Russell, Dow Theory Letters , May 2, 2008.
David Fuller (Fullermoney): The case for emerging markets
“The case for emerging markets from 2003 through 2005 was clear – they offered more attractive valuations in most instances and much better GDP growth rates. Today, emerging markets are on somewhat higher valuations, at least relative to European stock markets.
“So what is the investor to make of this?
“The two are not mutually exclusive, of course. I maintain that European markets are recovery candidates, provided the Wall Street leash effect remains neutral to mildly positive, as I suspect. Europe generally outperforms the USA in both directions, and is much more attractive in terms of yield.
“Historically, emerging markets have had a considerably higher beta than either the USA or Europe, and it may be prudent to conclude that this will remain the case. However, perceptions of risk are changing in favour of emerging (progressing) markets relative to developed (often regressing) economies.
“If ‘risk' means strong GDP growth, strong corporate profits growth, a firm currency and often a current account surplus, then give me more of that kind of risk … To each his own, but I personally will remain overweight in emerging markets.”
Source: David Fuller, Fullermoney , April 30, 2008.
John Authers (Financial Times): Rock bottom in Shanghai?
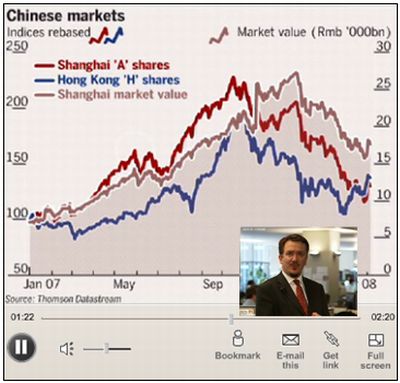
Source: John Authers, Financial Times , April 28, 2008.
Bloomberg: Japan's inflation bullish for stocks
“Japan's stocks may benefit from the end of deflation as companies raise prices, improving margins, CLSA's chief strategist Christopher Wood said.
“Rising inflation ‘is potentially hugely bullish for the Japanese stock market,' Wood wrote today in his ‘Greed & Fear' strategy note. The ‘bull story in Japan is all about a sustained move out of the nearly 20-year period of deflation with all that means for companies' pricing power and, consequently, their profit margins.'
“Consumer prices rose at the fastest pace in a decade in March, suggesting the economy has emerged from a deflationary spiral. Price gains also boosted expectations the Bank of Japan will raise interest rates, allowing banks to charge more for credit.
“Wood increased the weighting of banks in his model portfolio of Japanese shares, recommending investors hold 24% of their assets in the nation's four largest lenders. Banks comprise 12% of Japan's 1,722 member Topix index.
“‘The new BOJ leadership may just prove more committed to the worthy goal of normalising rates in Japan regardless of the external environment,' Wood wrote. ‘Certainly, ultra low interest rates have long ceased to be a positive factor in Japan.'”
Source: Patrick Rial, Bloomberg , April 28, 2008.
Barron's: US dollar looks ready to rally
“Don't believe the obituaries: The dollar isn't dead.
“When the Federal Reserve cuts interest rates for a seventh consecutive time this Wednesday, it will begin to wind down a pernicious campaign that has flooded the market with cheap dollars since last summer. At the same time, the whoosh of air from Europe's deflating credit bubble puts new pressure on the European Central Bank to begin cutting borrowing costs in order to goose growth.
The result should be a major shift in global monetary policy that reverses billions of recent short-dollar, long-commodity bets …”
Source: Barron's , April 28, 2008.
Bloomberg: Yuan posts biggest weekly loss in eight months
“The yuan posted its biggest weekly loss in eight months on speculation the central bank will curb the currency's appreciation as the economy slows.
“China's currency snapped two weeks of gains as the state-run Chinese Academy of Social Sciences said the economy will grow 10.7% this year, slowing from a 13-year high of 11.9% in 2007 because demand for exports will weaken. Premier Wen Jiabao said last week the country will balance the risk of a slump in growth against the threat from inflation at an 11-year high.
“‘Government officials are worried about a slowdown in the economy just as inflation poses a headache to them,' said Xing Ziqiang, an economist in Beijing with China International Capital Corp., the first Sino-foreign investment bank in China. ‘Textile companies and consumer goods producers are suffering quite a slowdown in export orders.'
“The yuan has dropped 0.24% this week, the most since the five-day period ended Aug. 17. The US currency has rallied this week, poised for the best week in a month against the euro.
“The yuan's appreciation has been ‘too fast' and the government should stabilize the foreign-exchange market, Market News International reported, citing a study by a government research institute. The State Information Center wrote in a report that one-way gains in the yuan are fueling expectations of further appreciation, according to Market News.”
Source: Kim Kyoungwha and Belinda Cao, Bloomberg , April 25, 2008.
Macquarie Research: Commodities – staying stronger for longer?
“Commodity prices sometimes surprise markets with their lack of cyclicality!
“Over the past half century, whenever there has been a US downturn without an emerging large economy industrialising, commodity prices have retreated quickly. By contrast, when there has been the presence of such an economy, commodity prices have not only surprised with the degree of their peaks, but also the duration of their resilience.
“The last two US downturns that occurred during such periods when emerging economies disproportionately contributed to global growth occurred in the late 1960s and early 1970s, following the long expansion of the industrialising Japan and the consequent acceleration of global inflation.
“Thus far there is evidence to suggest that this cycle for commodity prices is repeating the experience of 40 years ago, when they held ‘stronger for longer', rather than their abbreviated cycles seen during the recessions of the 1980s, 1990s and 2000s.”
Source: Macquarie Research , April 30, 2008.
John Hussman (Hussman Funds): Agricultural commodities in speculative bubble
“As for agricultural commodities, what we are observing is probably not a Malthusian breakpoint, but what I'd call ‘speculative hoarding'. Essentially, as the prices of commodities rise, particularly in developing nations, there is a tendency to save in the form of real goods. We've observed this historically in various countries as hoarding of every form of physical output …
“Some consumers have started hoarding rice, the food staple for half the world, as supplies shrink.
“In effect, we are observing a version of tulip-mania with foodstuffs. I would expect that prices will reach a speculative peak, probably within a few months, and then most probably plummet with very little in the way of relief rallies. That is a fairly predictable dynamic once commodity price movements reach the parabolic stage that they have entered lately. Still, it's not clear how high that parabola will ascend, because as the slope goes vertical, small differences in the exact point of the bust will lead to substantial differences in the price at the high. But the world has more arable land and more capacity to bring it into use within months and years than should cause near-term concern about a Malthuisan breakpoint.”
Source: John Hussman, Hussman Funds , April 28, 2008.
Bloomberg: Rice drops as US crop sowing accelerates
“Rice plunged the most in three weeks after a government report showed planting of the US crop accelerated, easing concern that global food supplies will lag behind demand.
“The cereal, the staple food for half the world, has tumbled for four days, declining 7%, after doubling in a year as China, Vietnam and India curbed exports. Record prices stoked social tension in Asia and Africa and prompted Wal-Mart Stores Inc.'s Sam's Club to limit purchases of jasmine, basmati and long-grain white rice in US stores.
“‘Supplies of the grain are sufficient, but there was a bottleneck because of speculative hoarding in some countries,' said Nicholas Chung, senior manager at Korea Development Bank.”
Source: Jae Hur, Bloomberg , April 29, 2008.
GaveKal: Wheat, rice and soy prices rolling over
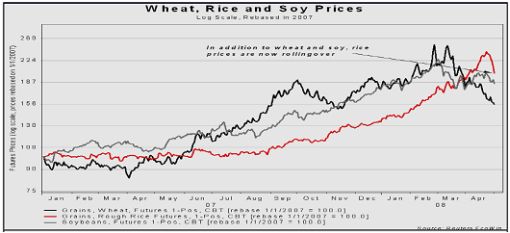
Source: GaveKal – Checking the Boxes , May 2, 2008.
Financial Times: Opec says oil could hit $200
“Opec's president on Monday warned oil prices could hit $200 a barrel and there would be little the cartel could do to help.
“The comments made by Chakib Khelil, Algeria's energy minister, came as oil prices hit a historic peak close to $120 a barrel, putting further pressure on global economies.
“His remarks suggest Algeria wants Opec to continue to resist calls by US and European leaders for the cartel to pump more oil to help ease prices. But Mr Khelil blamed record oil prices on the weak dollar and global political insecurity.
“He told El Moudjahid, Algeria's government newspaper: ‘I don't think that an increase in production would help lower prices, because there is a balance between supply and demand and the stocks of gasoline in the United States have recorded a surplus and are at their highest level for five years.'
“He added: ‘The prices are high due to the recession in the United States and the economic crisis, which has touched several countries, a situation that has an effect on the value of the dollar. Each time the dollar falls 1%, the price of the barrel rises by $4 and of course vice versa.'”
Source: Carola Hoyos, Financial Times , April 28, 2008.
John Reade (UBS): Copper conundrum
“The copper market is a strange place at the moment, says John Reade, head of metals strategy at UBS, who notes that available stocks of the red metal have fallen sharply this year.
“‘The copper price is high and there are tremendous supply disruptions and production interruptions,' says Mr Reade: ‘Yet demand is patchy, weak in the US as demonstrated by comments from some Codelco customers but stronger in Europe, based on recent increases in physical premiums.'
“Codelco, the world's largest producer, is reported to have asked some US customers to consider delaying orders if strikes in Chile continue.
“Although China imported a lot of copper in the first quarter, the spread between London Metal Exchange copper prices and those in Shanghai has risen to levels not seen since late 2006.
“UBS says the high level of the LME/Shanghai spread indicates Chinese traders have little interest in LME copper at current price levels and it also points to a future slowdown in Chinese imports of copper.
“Mr Reade says that data on speculative positioning from Nymex suggests investors are now ‘long' copper, but he questions whether it is reasonable to expect copper prices to move much higher from current levels, barring an acute intensification in production interruptions. ‘Impossible to be short, unattractive to get long: this is the copper conundrum,' he says.”
Source: John Reade, UBS (via Financial Times ), May 1, 2008.
Financial Times: Eurozone economic confidence slips rapidly
“Economic confidence across the eurozone is eroding rapidly, with increasing signs that the growth slowdown is hitting the region's labour market, a closely-watched survey has shown.
“The European Commission's eurozone ‘economic sentiment' index has fallen sharply from 99.6 in March to 97.1 in April – the lowest level since August 2005. With the indicator regarded as good guide to growth trends, the unexpectedly steep decline pointed to a marked deceleration in economic activity.
“However, the ECB expects inflation to moderate only gradually over the next 18 months – and earlier this week the Commission forecast that in 2009 the average rate would still be above the central bank's goal of an annual rate ‘below but close' to 2%.
“… eurozone countries show varying performances. Economic sentiment in Spain, which is at risk of a serious house price correction, has fallen to the lowest level since late 1993. But sentiment in Germany and France remains relatively robust – falling to the lowest levels since February 2006 and December 2005 respectively.
“Jean-Claude Trichet, ECB president, struck a cautious tone in Austrian newspaper interviews published on Wednesday saying growth in the first quarter had been ‘quite robust' and was expected to be ‘reasonably resilient' in the first half of the year. But he said forecasts by the International Monetary Fund showing a sharp slowdown this year ‘may be too pessimistic'.”
Source: Ralph Atkins, Financial Times , April 30, 2008.
This is money: Bank bail-outs to be kept secret
“The Bank of England has imposed a permanent news blackout on its £50 billion-plus plan to ease the credit crunch.
“Ferocious and unprecedented secrecy means taxpayers will never know the names of the banks that have been supported through the special liquidity scheme, which was unveiled by Bank Governor Mervyn King last week.
“Requests under the Freedom of Information Act are to be denied. Details will be kept secret even after 30 years – the period after which all but the most sensitive state documents are released.
“Any Bank of England employee leaking the names of institutions involved will face court action for breach of contract.
“This hypersensitive official stance is thought to be a response to the events of last year when a huge stigma was attached to any lender suspected of going to the Bank for cash help. The scheme is intended to steady the markets, but it is feared that reports of banks making widespread use of the facility could trigger further instability.”
Source: Dan Atkinson, Simon Watkins, This is money , April 27, 2008.
Did you enjoy this posting? If so, click here to subscribe to updates to Investment Postcards from Cape Town by e-mail.
By Dr Prieur du Plessis
Dr Prieur du Plessis is an investment professional with 25 years' experience in investment research and portfolio management.
More than 1200 of his articles on investment-related topics have been published in various regular newspaper, journal and Internet columns (including his blog, Investment Postcards from Cape Town : www.investmentpostcards.com ). He has also published a book, Financial Basics: Investment.
Prieur is chairman and principal shareholder of South African-based Plexus Asset Management , which he founded in 1995. The group conducts investment management, investment consulting, private equity and real estate activities in South Africa and other African countries.
Plexus is the South African partner of John Mauldin , Dallas-based author of the popular Thoughts from the Frontline newsletter, and also has an exclusive licensing agreement with California-based Research Affiliates for managing and distributing its enhanced Fundamental Index™ methodology in the Pan-African area.
Prieur is 53 years old and live with his wife, television producer and presenter Isabel Verwey, and two children in Cape Town , South Africa . His leisure activities include long-distance running, traveling, reading and motor-cycling.
Copyright © 2008 by Prieur du Plessis - All rights reserved.
Disclaimer: The above is a matter of opinion and is not intended as investment advice. Information and analysis above are derived from sources and utilizing methods believed reliable, but we cannot accept responsibility for any trading losses you may incur as a result of this analysis. Do your own due diligence.
Prieur du Plessis Archive |
© 2005-2022 http://www.MarketOracle.co.uk - The Market Oracle is a FREE Daily Financial Markets Analysis & Forecasting online publication.