


Stock Market Near All Time Highs
Stock-Markets / Stock Markets 2014 May 25, 2014 - 01:00 PM GMTBy: Tony_Caldaro

 The week started with a positive Monday, sold off on Tuesday, then ended within one point of the SPX 1902 all time high. The SPX/DOW were +0.95%, the NDX/NAZ were +2.40%, and the DJ World was +0.90%. On the economic front positive reports outpaced the negative 5 to 1. On the uptick: existing/new home sales, leading indicators, the WLEI and the M1-multipler. On the downtick: weekly jobless claims rose. Next week, holiday shortened by Monday’s Memorial Day, we get the second estimate for Q1 GDP, Personal income/spending and the Chicago PMI.
LONG TERM: bull market
The Cycle wave [1] bull market continues to unfold as expected. Primary waves I and II completed in 2011, and Primary III has been underway since then. When Primary III concludes we should get a multi-month 15% to 20% correction for Primary IV. Then another uptrend(s) to new highs completing Primary wave V and the bull market.
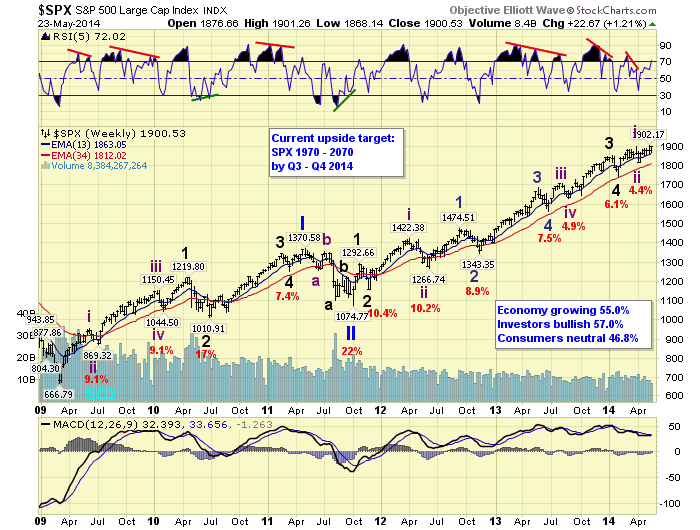
The two year Primary wave I unfolded in five Major waves with a subdividing Major wave 1. Primary II then took five months to unfold and the market lost 22% of its value. The current three year Primary wave III has also unfolded in five Major waves. But this time Major waves 3 and 5 subdivided. Major waves 1 and 2 completed in late-2011, and Major waves 3 and 4 completed in early-2014. Major wave 5 has been underway since that early-February low.
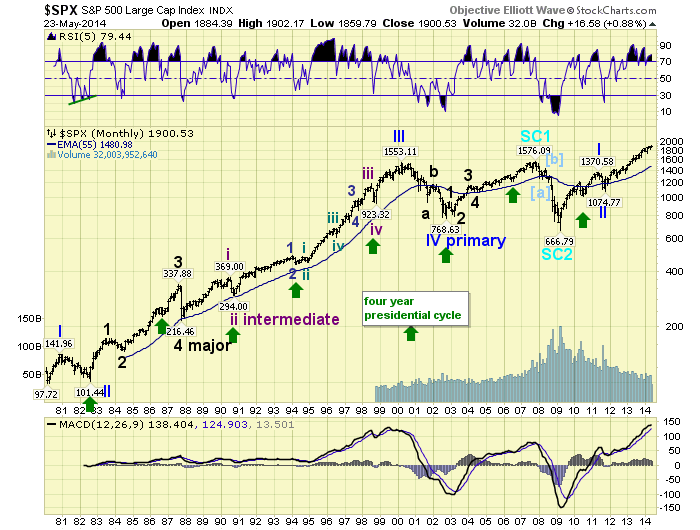
There is also a long term cycle low due this year: the four year Presidential cycle. Every four years this cycle low marks the low market price for the year. In recent cycles the month of July has marked the low, i.e. 2006 and 2010. Historically, however, July and October have had equal weight in marking the cycle low. Recent October lows occurred in 1998 and 2002. This year we may see a July high in price, and then an October cycle low.
MEDIUM TERM: uptrend
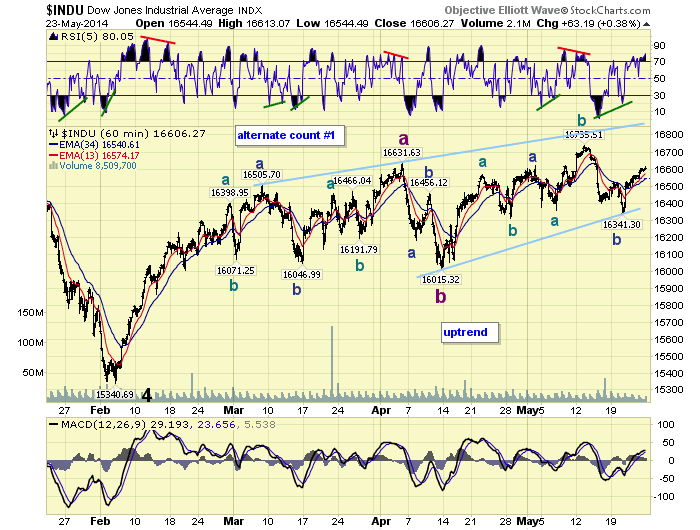
While many have been tracking a large potential diagonal in the SPX/DOW indices, and expecting a big decline. The count in the NDX/NAZ indices has suggested they are not done with Primary III just yet. We detailed our analysis on these two indices in last weekend’s update. This weekend we detail two potential patterns unfolding in the SPX/DOW. And, both generally point higher into the July/August summer months.
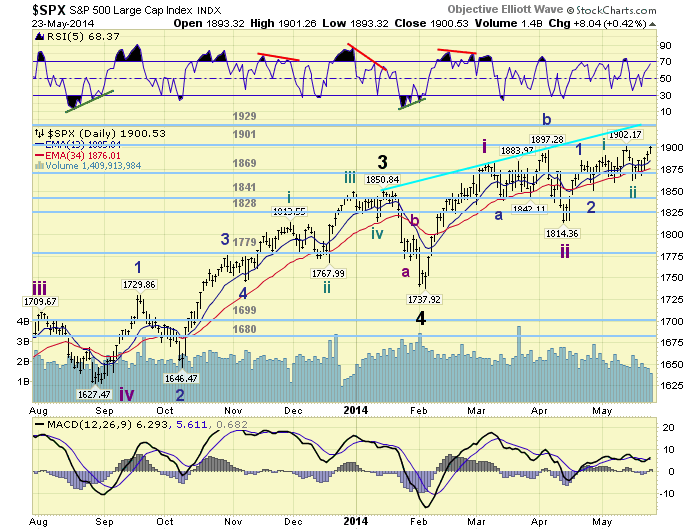
In each case we continue to count the February low as the end of Major wave 4 of Primary III. Since that low Major wave 5 has been underway. What has followed was an uptrend into early-April, a small downtrend into mid-April, and now another uptrend. Since both uptrends have been quite choppy, there are actually two ways of counting them.
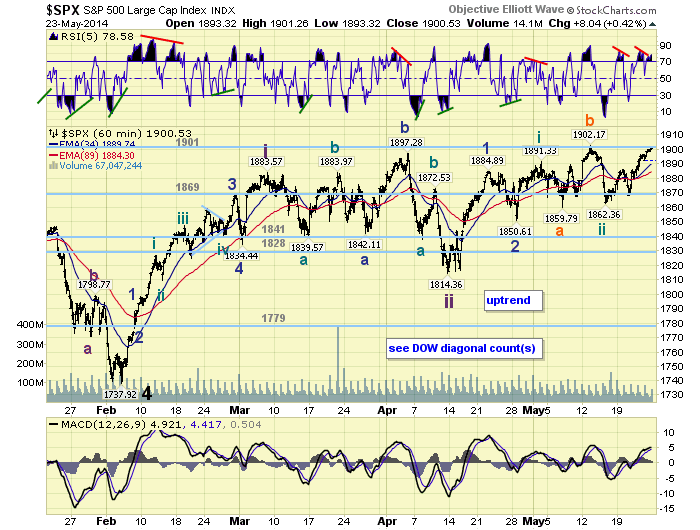
The first count, which is much more bullish than the second, suggests an Int. wave one to SPX 1884, followed by an irregular zigzag to 1814 to end the correction. After the mid-April low we have a nesting pattern of 1-2-i-ii with wave iii underway now.
Here we count the entire Feb-Apr uptrend as an a-b-c Int. wave a, followed by an Int. wave b correction into mid-April. The current uptrend is also counted as a series of threes, which is typical of an ongoing a-b-c-d-e diagonal triangle. Notice the contracting trend lines that are forming. As noted above, regardless of the outcome both counts suggest higher highs for this uptrend. This will be followed by a correction, and then even higher highs, in another uptrend, to end Primary wave III.
Should the count posted on the SPX be the correct one, we should expect a Primary III high around SPX 2070. Should the count posted on the DOW be correct, the SPX should top around 1970 for Primary III. Medium term support is at the 1869 and 1841 pivots, with resistance at the 1901 and 1929 pivots.
SHORT TERM
Short term support is at SPX 1891 and the 1869 pivot, with resistance at the 1901 and 1929 pivots. Short term momentum ended the week quite overbought with a negative divergence. The short term OEW charts remain positive with the reversal level now SPX 1896.
Since we posted the hourly chart in the previous section we post the daily chart above. The NDX ended the week only 1.7% below its previous uptrend high. However, the NAZ is still 4.4% below its high and 5.6% below our projected NAZ 4420 uptrend target. Even if the NAZ outpaces the SPX two to one, in percentage terms, to reach its uptrend high. The SPX still needs to rise between 2.2% and 2.8% from Friday’s 1901 close. This projects a range of SPX 1943 to 1954 before the current uptrend ends. The next OEW pivot after 1929 is 1956.
If the SPX does top around the 1956 pivot, then the count posted on the DOW hourly chart is still in play, as the next correction would almost assuredly overlap the previous uptrend high at 1897. If the NDX/NAZ start surging, then the count posted on the SPX charts remains in play. It looks like we will reach an inflection point in the month of June. Best to your trading!
FOREIGN MARKETS
The Asian markets were mostly higher for a net gain of 0.8%.
The European markets were also mostly higher for a net gain of 1.5%.
The Commodity equity group were mixed for a net gain of 1.3%.
The DJ World index is still uptrending and gained 0.9% on the week.
COMMODITIES
Bonds continued their uptrend, but ended the week flat.
Crude (+2.2%) may be uptrending again as it continues its roller coaster ride above $90.
Gold (unch.) is still struggling to start a new uptrend. We think it will happen soon.
The USD looks like it has bottomed gaining 0.4% on the week.
NEXT WEEK
Tuesday: Durable goods at 8:30, Case-Shiller and the FHFA housing index at 9am, then Consumer confidence at 10am. Thursday: Q1 GDP (est. -0.5%) and weekly Jobless claims at 8:30, then Pending home sales at 10am. Friday: Personal income/spending and PCE prices at 8:30, the Chicago PMI at 9:45, then Consumer sentiment at 9:55. The FED has nothing scheduled for the week. Best to your weekend and week!
CHARTS: http://stockcharts.com/public/1269446/tenpp
http://caldaroew.spaces.live.com
After about 40 years of investing in the markets one learns that the markets are constantly changing, not only in price, but in what drives the markets. In the 1960s, the Nifty Fifty were the leaders of the stock market. In the 1970s, stock selection using Technical Analysis was important, as the market stayed with a trading range for the entire decade. In the 1980s, the market finally broke out of it doldrums, as the DOW broke through 1100 in 1982, and launched the greatest bull market on record.
Sharing is an important aspect of a life. Over 100 people have joined our group, from all walks of life, covering twenty three countries across the globe. It's been the most fun I have ever had in the market. Sharing uncommon knowledge, with investors. In hope of aiding them in finding their financial independence.
Copyright © 2014 Tony Caldaro - All Rights Reserved Disclaimer: The above is a matter of opinion provided for general information purposes only and is not intended as investment advice. Information and analysis above are derived from sources and utilising methods believed to be reliable, but we cannot accept responsibility for any losses you may incur as a result of this analysis. Individuals should consult with their personal financial advisors.
Tony Caldaro Archive |
© 2005-2022 http://www.MarketOracle.co.uk - The Market Oracle is a FREE Daily Financial Markets Analysis & Forecasting online publication.