


Crude Oil Price At Crossroads
Commodities / Crude Oil May 19, 2014 - 04:28 PM GMTBy: Nadia_Simmons

 On Friday, crude oil gained 0.61% as strong U.S. economic data and ongoing worries over the crisis in Ukraine weighted on the price. Thanks to these circumstances, light crude came back above $102, but does this growth change the short-term outlook for the commodity?
On Friday, better-than-expected numbers from the housing sector gave crude oil a support. The Census Bureau reported that U.S. building permits rose 8% to 1.080 million units last month (while analysts had expected an increase to 1.010 million units in April) and the Commerce Department showed that U.S. housing starts rose 13.2% last month to 1.072 million units, beating expectations of 980,000 gain (it was the largest increase in five months).
The commodity was also supported by heightened tensions between Russia and Ukraine as Russia informed the EU that it would stop natural-gas deliveries to Ukraine on June 1 unless it receives payments for past-due amounts. Ukraine said it is preparing to pay $4 billion to Gazprom but hopes to negotiate lower prices. These events fueled worries about the potential supply interruptions from the region and pushed the price of light crude to over $102 per barrel once again.
Will we see the commodity higher in the coming days? Let’s check the technical picture of crude oil (charts courtesy of http://stockcharts.com).
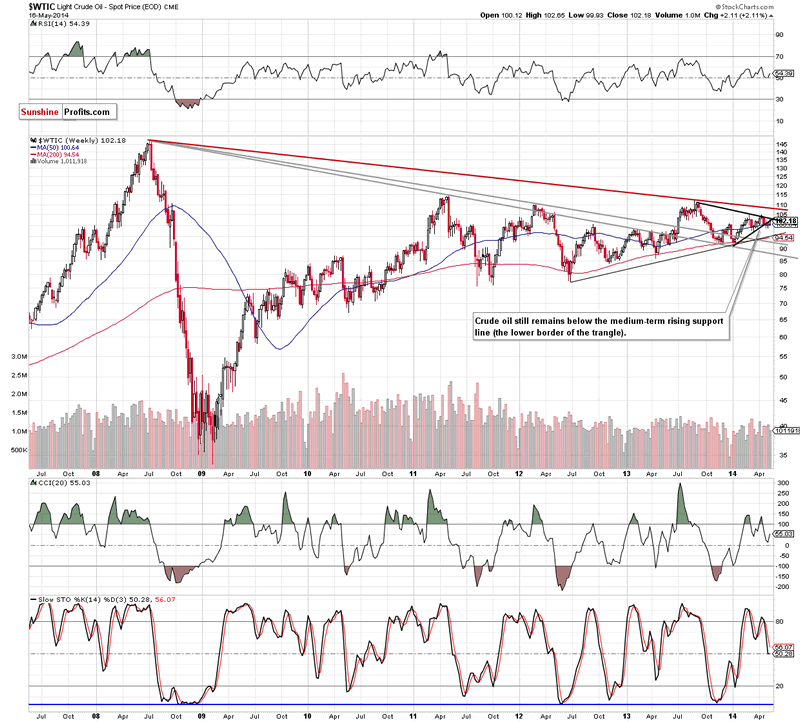
Although crude oil gained 2.11% in the previous week, the medium-term situation hasn’t changed much as the commodity still remains below both medium-term resistance lines. Therefore, what we wrote in our last Oil Trading Alert is up-to-date:
(…) we remain convinced that as long as this strong resisrance lines remain in play further deterioration is still likely. (…) from this perspective, the recent upward move seems to be nothing more than a veryfication of the breakdown. If this is the case, the bearish scenario (…) will be in play:
(…) if the commodity extends losses (…), we will likely see further deterioration and a drop even to around $95, where the medium-term support line (based on the June 2012 and January 2014 lows) is.
What can we infer from the short-term chart?
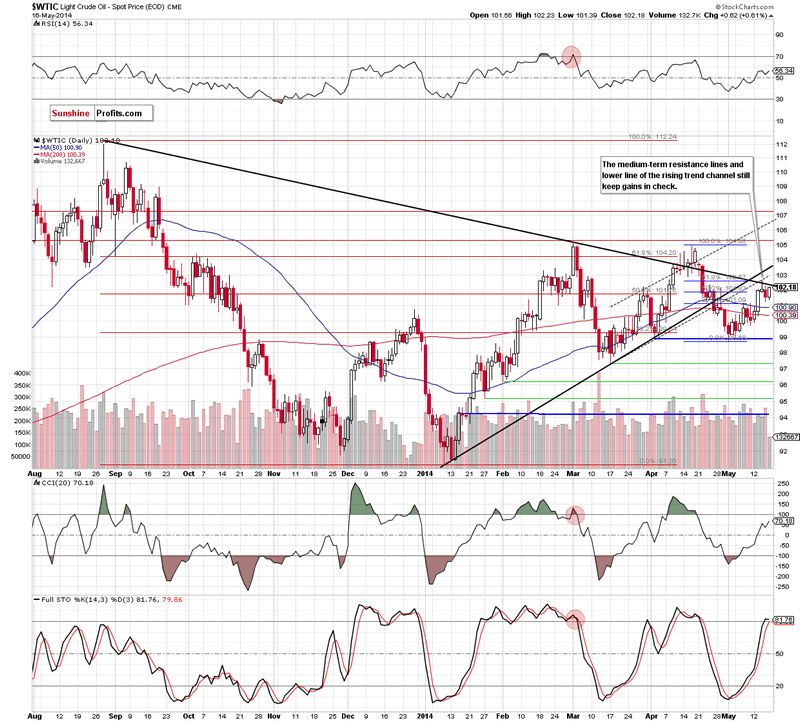
Looking at the daily chart, we see that although crude oil moved higher once again, the very-short term situation hasn’t changed much. Despite Friday’s improvement, the commodity still remains below the medium-term declining resistance line (the upper line of the triangle). In our opinion, even if cude oil climbs above this line, the combination of the black rising line (the lower border of the tringle), the lower line of the rising trend channel (currently around $103) and the 61.8% Fibonacci retracement will be strong enough to stop further improvement and trigger a downswing – similarly to what we noticed on Wednesday. Please note that Friday’s upswing materialized on very small volume (compared to the previous days), which questions the strength of oil bulls and reinforces the bearish scenario.
Summing up, taking all the above into account, we remain bearish and think that lower values of crude oil are still ahead us. As we have pointed out before, it seems quite likely that even if crude oil climbs higher, the above-mentioned resistance zone will be strong enough to stop further improvement and trigger a pullback in the near future. If this is the case, the nearest support will be the previously-broken 50-day moving average (currently around $100.90).
Very short-term outlook: bearish
Short-term outlook: bearish
MT outlook: mixed
LT outlook: mixed
Trading position (short-term): Short. Stop-loss order: $104.
Thank you.
Nadia Simmons
Sunshine Profits‘ Contributing Author
Oil Investment Updates
Oil Trading Alerts
* * * * *
Disclaimer
All essays, research and information found above represent analyses and opinions of Nadia Simmons and Sunshine Profits' associates only. As such, it may prove wrong and be a subject to change without notice. Opinions and analyses were based on data available to authors of respective essays at the time of writing. Although the information provided above is based on careful research and sources that are believed to be accurate, Nadia Simmons and his associates do not guarantee the accuracy or thoroughness of the data or information reported. The opinions published above are neither an offer nor a recommendation to purchase or sell any securities. Nadia Simmons is not a Registered Securities Advisor. By reading Nadia Simmons’ reports you fully agree that he will not be held responsible or liable for any decisions you make regarding any information provided in these reports. Investing, trading and speculation in any financial markets may involve high risk of loss. Nadia Simmons, Sunshine Profits' employees and affiliates as well as members of their families may have a short or long position in any securities, including those mentioned in any of the reports or essays, and may make additional purchases and/or sales of those securities without notice.
© 2005-2022 http://www.MarketOracle.co.uk - The Market Oracle is a FREE Daily Financial Markets Analysis & Forecasting online publication.