


Breakthrough in Crude Oil Price Only A Matter Of Time
Commodities / Crude Oil May 12, 2014 - 06:57 PM GMTBy: Nadia_Simmons

 On Friday, crude oil hit an intraday high of $101.18 supported by ongoing concerns over tensions in Ukraine. Despite this improvement, the commodity reversed and lost 0.20% as weaker-than-expected economic data from China and a stronger dollar weighted on the price. Because of these circumstances, light crude erased earlier gains and temporarily slipped below the psychological barrier of $100 once again. Is it enough to trigger another sizable downswing?
At the end of last week, pro-Russia separatists in eastern Ukraine ignored a public call by Russian President Vladimir Putin to postpone a referendum and said they plan to go ahead on Sunday with a vote. These circumstances fueled concerns that Ukraine is descending into civil war and pushed light crude to around $101(as a reminder, in recent weeks, worries that higher tensions between Russia and the West over the unrest in Ukraine could lead to further sanctions, which could crimp Russian oil exports have kept oil prices above the level of $100). In reaction to this news, oil investors locked in their profits and jumped to the sidelines to await fresh news from Ukraine. As a result, the price of crude oil reversed and declined.
An additional bearish factor that weighted on investors' sentiment was soft Chinese pricing data released earlier on Friday, which showed that China's April consumer price index rose 1.8% year-on-year (missing expectations for a 2.0% increase). Additionally, the country's producer price index fell 2.0%, while analysts had expected a 1.8% drop.
On top of that, a stronger dollar pushed oil prices down as well. As is well known, crude oil is traded in dollars and a strong greenback makes the commodity more expensive to buyers using other currencies.
Once we know major fundamental factors that affected the commodity on Friday, let's find out what impact did they have on the technical picture of crude oil (charts courtesy of http://stockcharts.com).
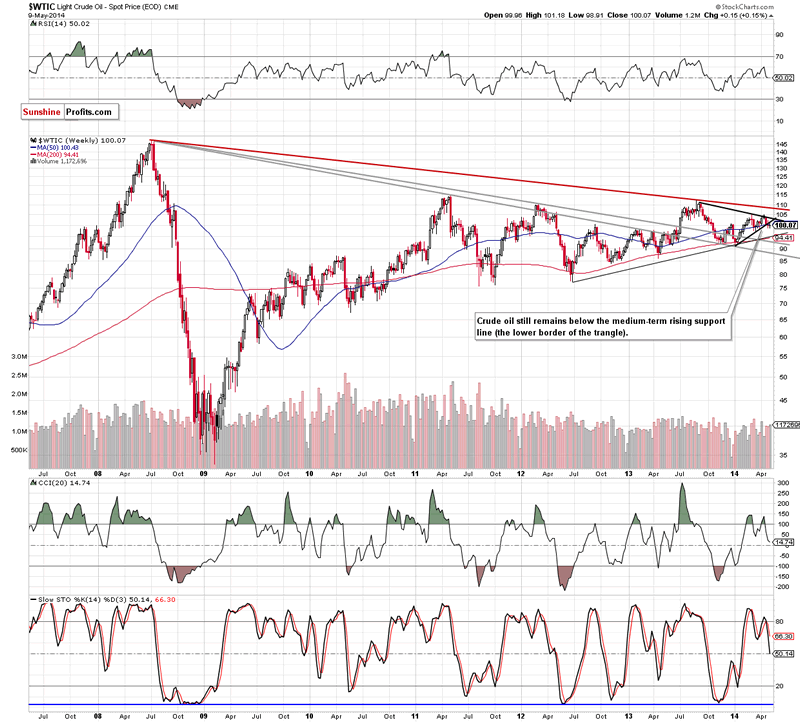
Although crude oil gained 0.15% in the previous week (for the first time in three weeks), the medium-term situation hasn't changed much as the commodity still remains below the lower border of the triangle. Therefore, the bearish scenario from our Oil Traing Alert posted on Apr. 30 is still up-to-date:
(...) if the commodity extends losses and drops below the psychological barrier of $100, we will likely see further deterioration and a drop even to around $95, where the medium-term support line (based on the June 2012 and January 2014 lows) is. At this point, it's worth noting that the CCI and Stochastic Oscillator generated sell signals, which suggests that another attempt to move lower should not surprise us.
Are there any short-term signals on the horizon that could push light crude higher or lower in the near future? Let's zoom in on our picture and find out.
Quoting our last Oil Trading Alert:
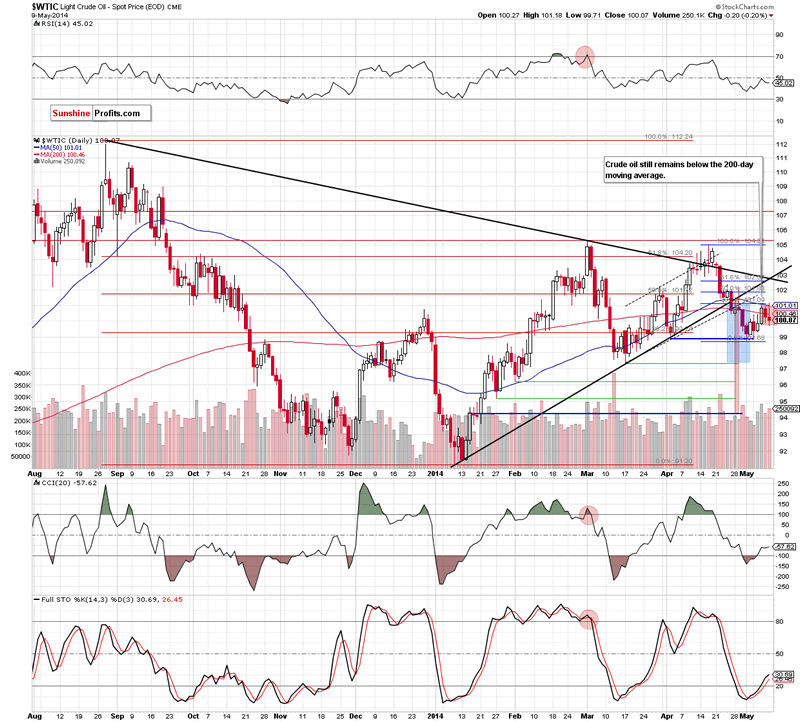
(...) as long as the price remains above the key level of $100, another attempt to move higher should not surprise us. (...) if crude oil rebounds (and even comes back above the 200-day moving average - currently at $100.49), the resistance zone created by the 50-day moving average and the 38.2% Fibonacci retracement, will likely pause or stop further improvement once again.
As you see on the above chart, we noticed such price action on Friday. As a result, light crude declined and closed below the 200-day moving average for the second day in a row, which is a bearish signal. On top of that, we noticed another test of the strength of the psychological barrier of $100. So far, it holds, but what's next for crude oil? Technically, the commodity is currently consolidating between the the key support level and the above-mentioned resistance zone. Taking this fact into account, we think that as long as there is no breakout above the major resistance area (or breakdown below the level of $100) another sizable move is not likely to be seen. Please note that even if the commodity climbs above the resistance zone and reaches the next Fibonacci retracement (around $101.80), the breakdown below the major resistance lines and its consequences still will be in play.
Summing up, although crude oil moved higher and (very temporarily) broke above $101, the commodity reversed and closed the day below 200-day moving average once again, which provide us with bearish implications. Nevertheless, we still keep in mind that crude oil remains above the psychological barrier of $100. Therefore, if it holds after the market's open, we will see another attempt to break above the resistance zone (around $101.05-$101.13) created by the 50-day moving average and the 38.2% Fibonacci retracement (similarly to Friday's price action). However, if declines continue and crude oil drops below $100, we will likely see a pullback to the May low in the near future. Either way it still seems that we will see visibly lower crude oil values in the coming weeks.
Very short-term outlook: bearish Short-term outlook: bearish MT outlook: mixed LT outlook: mixed
Trading position (short-term): Short. Stop-loss order: $102.50.
Thank you.
Nadia Simmons
Sunshine Profits‘ Contributing Author
Oil Investment Updates
Oil Trading Alerts
* * * * *
Disclaimer
All essays, research and information found above represent analyses and opinions of Nadia Simmons and Sunshine Profits' associates only. As such, it may prove wrong and be a subject to change without notice. Opinions and analyses were based on data available to authors of respective essays at the time of writing. Although the information provided above is based on careful research and sources that are believed to be accurate, Nadia Simmons and his associates do not guarantee the accuracy or thoroughness of the data or information reported. The opinions published above are neither an offer nor a recommendation to purchase or sell any securities. Nadia Simmons is not a Registered Securities Advisor. By reading Nadia Simmons’ reports you fully agree that he will not be held responsible or liable for any decisions you make regarding any information provided in these reports. Investing, trading and speculation in any financial markets may involve high risk of loss. Nadia Simmons, Sunshine Profits' employees and affiliates as well as members of their families may have a short or long position in any securities, including those mentioned in any of the reports or essays, and may make additional purchases and/or sales of those securities without notice.
© 2005-2022 http://www.MarketOracle.co.uk - The Market Oracle is a FREE Daily Financial Markets Analysis & Forecasting online publication.