Why is Gold Behaving this Way?
Commodities / Gold and Silver 2014 May 01, 2014 - 12:27 PM GMTBy: Brian_Bloom
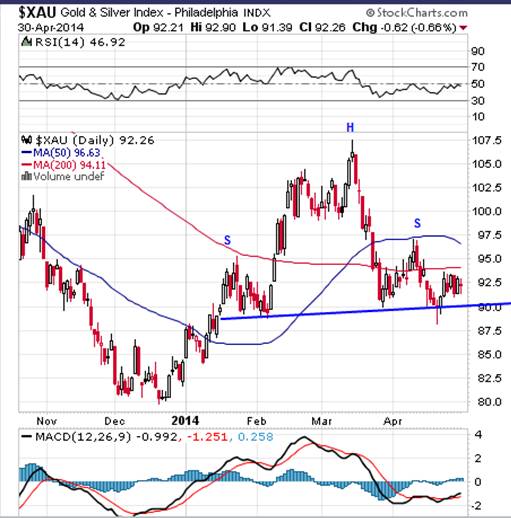
 The chart of the gold and silver share price index below (source: Stockcharts.com) may be very worrying to some, and it may be a source of great relief to others. It shows a potential Head and Shoulders reversal pattern, with a neckline at 90 and a peak of 107.5. If the neckline is penetrated significantly on the downside, theory says that the target destination will be 90 – 17.5 = 72.5, which will imply a fall of 22% from current levels.
Chart #1 – $XAU
Of some significance, the relative strength chart below (also courtesy Stockcharts.com) shows that gold shares have been underperforming relative to the gold price since the emergence of the Global Financial Crisis.
Chart #2 – Ratio of XAU:$GOLD
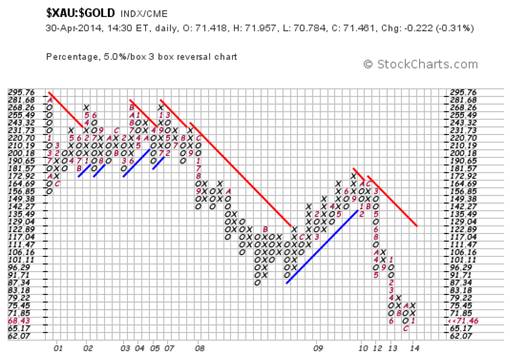
One implication is that, if the Head and Shoulders formation in the first chart should break down, the consolidation in the second chart might also experience a breakout to the downside and, should this happen, the potential downside move of the ratio might be as much as 36% from current levels. Effectively, this scenario is ringing a warning bell regarding the viability of the broader gold mining industry – should the technical picture evolve as described.
Why is this happening? At face value it makes no sense.
In particular, have a look at the chart of the US Dollar Index below:
Chart #3 – US Dollar Index
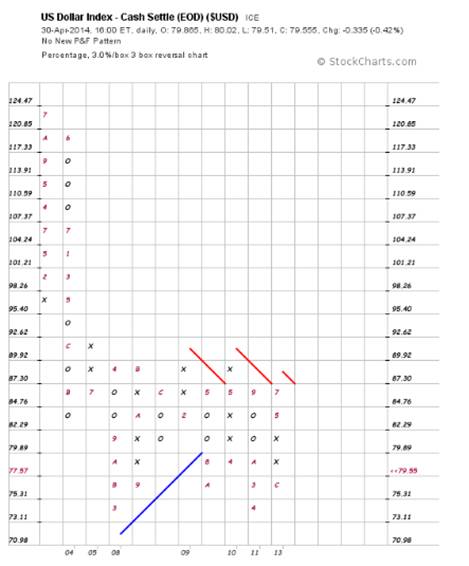
Clearly, the US Dollar is struggling to remain in the trading range between 73 cents and 87 cents that has prevailed since the emergence of the GFC.
But the dollar index might not break down. Paradoxically, the chart below of the S&P Global 1200 (Yahoo.com), is showing signs of wanting to continue rising to new heights.
Chart #4 – S&P Global 1200
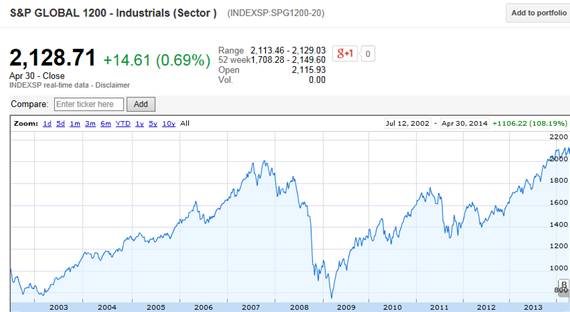
All this might argue for a bullish case that the worst of the GFC may be over, panic is receding, and we will all live happily ever after.
Against this background, we have a technical dichotomy because the US Dow Jones is also rising to new heights – in the face of a dollar that is struggling to maintain its levels.
Chart #5 – Dow Jones Index (Point & Figure)
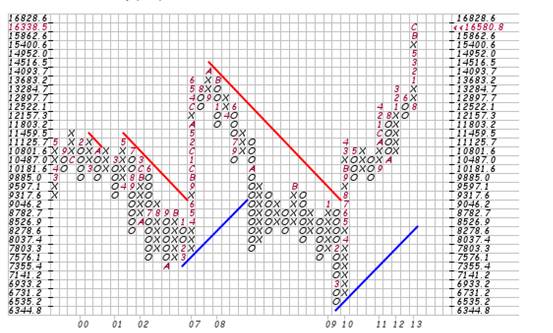
By implication, if the US Dollar falls, it will require more US Dollars to pay for imports, and if volumes do not increase, exports will generate fewer US Dollars – if the exports are priced in foreign currencies. Such an outcome will not auger well for the US economy.
However, if the exports are priced in US Dollars then the US’s balance of payments will be protected, provided the emphasis within the US economy shifts from consumerism towards the building of multinational oriented businesses such as those in the energy industry. Perhaps the latter logic might be serving to place a floor under the dollar index even as the relationship of the dollar to the Chinese Yuan weakens.
The chart below is particularly interesting. It shows that the Chinese Yuan/US Dollar exchange rate may be positioning to rise, having broken above a 10 year down trend line. (source:http://www.xe.com/currencycharts/?from=USD&to=CNY&view=10Y )
Chart # 6 – Chinese Yuan/ US Dollar exchange rate
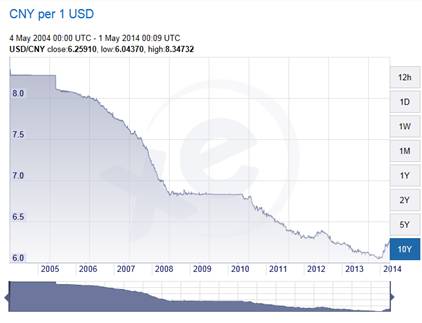
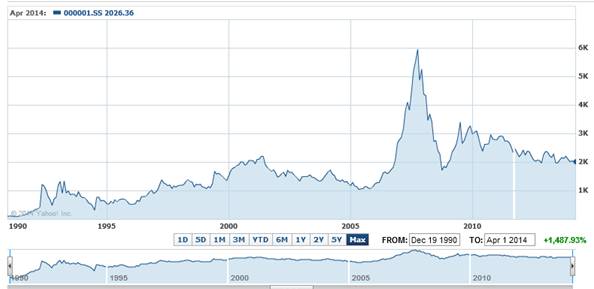
This may not be such a good outcome from the Chinese perspective, because their products will become expensive from the perspective of US consumers. Of interest, the chart of the Shanghai Index below (Yahoo.com) has been languishing around the lows that it reached post GFC, and is showing no signs of wanting to rise.
Chart #7 – Shanghai Stock Index
What all this “might” indicate is that the teeter-totter of the global economy might be levelling out and that the balance of economic activity might start to shift back towards the US. If so, the fear of global collapse may be waning – which some might argue is why the gold price is looking vulnerable. Those same people might argue that, therefore, the US Dollar index will not break down but might remain in its trading range. Further, given the growth of the US energy industry, this might imply that the US economy is over the worst and is no longer dependent for its stability on continued consumption funded by debt.
Sound great?
Yeah, it would be great – everything else being equal.
Unfortunately, everything else is not equal. Whilst I have stopped blogging in recent months, I was motivated to write this particular missive because of an article that appeared in my inbox recently. It was about Michael Lewis, and his recently published book, ‘Flash Boys’: http://www.theguardian.com/business/2014/apr/06/michael-lewis-flash-boys-high-frequency-traders
Basically, Lewis contends that the world’s stock markets are rigged and it seems to me that anyone interested in this subject will be well advised to Google Michael Lewis and Flash Boys. He has given more than one interview on the subject, and what he has to say is very chilling.
Conclusion
The rules of the game of “investing” may have changed to such an extent as to have dealt a death blow to the world’s capital markets. Unfortunately, cyclicality is an immutable law of nature. Therefore, ‘what goes up must come down’. If the rev-heads who are orchestrating high frequency trading have effectively succeeded in deferring the arrival of the “down” phase, then the energy in that down phase – when it comes – will very likely be comparable to a hurricane. More unfortunately, timing is impossible to anticipate.
Author Note: Of course, such an outcome may still be avoidable; provided we come to our senses and start to place a greater emphasis on ethical behaviour. My two novels – which can be acquired in e-book format from Amazon, Barnes & Noble and other platforms – approach the problems facing humanity from this perspective.
Author, Beyond Neanderthal and The Last Finesse
Links to Amazon reader reviews of Brian Bloom’s fact-based novels:
Beyond Neanderthal and The Last Finesse are now available to purchase in e-book format, at under US$10 a copy, via almost 60 web based book retailers across the globe. In addition to Kindle, the entertaining, easy-to-read fact based adventure novels may also be downloaded on Kindle for PC, iPhone, iPod Touch, Blackberry, Nook, iPad and Adobe Digital Editions. Together, these two books offer a holistic right brain/left brain view of the current human condition, and of possibilities for a more positive future for humanity.
Copyright © 2013 Brian Bloom - All Rights Reserved
Disclaimer: The above is a matter of opinion provided for general information purposes only and is not intended as investment advice. Information and analysis above are derived from sources and utilising methods believed to be reliable, but we cannot accept responsibility for any losses you may incur as a result of this analysis. Individuals should consult with their personal financial advisors.
Brian Bloom Archive |
© 2005-2022 http://www.MarketOracle.co.uk - The Market Oracle is a FREE Daily Financial Markets Analysis & Forecasting online publication.


