


Inflection Points for Gold, Silver and the U.S. Dollar
Commodities / Gold and Silver 2014 Mar 24, 2014 - 11:27 AM GMT

 As we all know last week was a tough week in the PM sector. The real question we have to ask is whether this was just a short term correction in the uptrend that started at the December low or is this the end of the three month rally? We’ll look at some charts to see if we can answer this question.
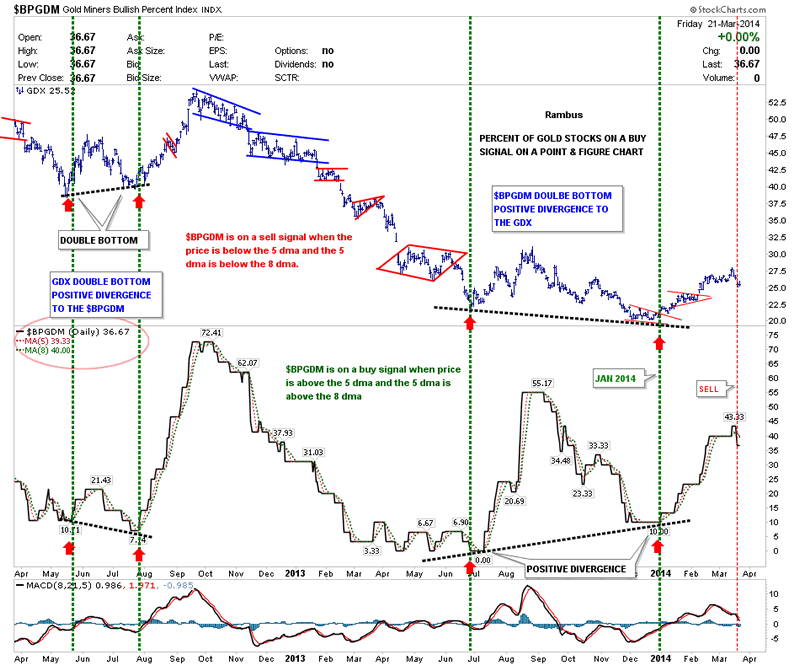
Lets start with the BPGDM chart that I showed you last week which was real close to giving a sell signal. We were just waiting for the 5 dma to cross below the 8 dma to confirm the sell signal. We got that last Friday so it’s officially on a sell signal now. The red circle shows the BPGDM is down to 36.67 with the 5 dma at 39.33 and the 8 dma now the highest at 40. This is the alignment we want to see for a sell signal.
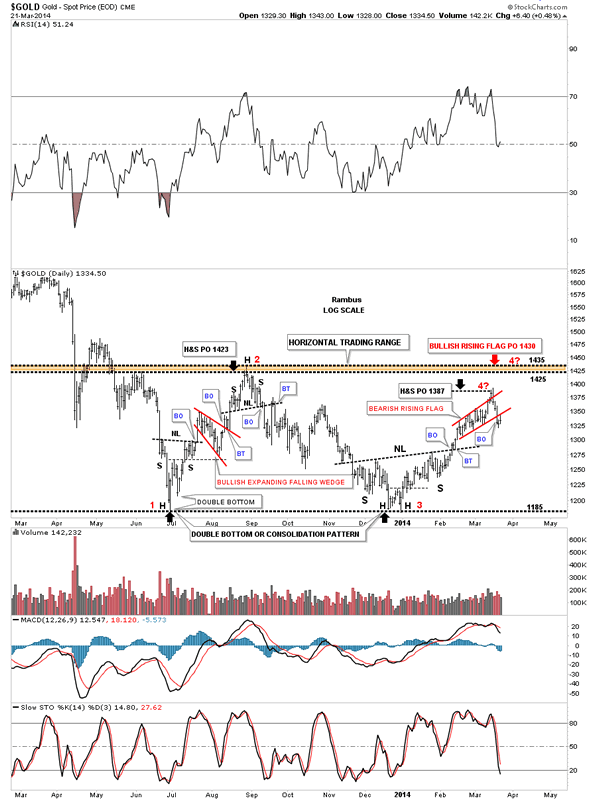
The precious metals complex has been in a trading range since the June low made last year. There is still no confirmation yet if this sideways trading range is a double bottom reversal pattern or just a consolidation pattern. The trading range on gold has had three reversal points so far as you can see on the chart below. I’ve been looking for the price action to reach the August high made last year at the 1430 area where we would then sell regardless if gold was going to move higher. Everybody and their brother knows the 1430 is a hot zone and will be selling. I had originally labeled the red rising flag as a bullish rising flag as it was forming as a halfway pattern with a price objective up to 1430 which fit in perfectly. You can see the red rising flag had a false breakout through the top rail and turned down hard breaking below the bottom red rail. I’ve renamed the red rising flag to a bearish rising flag and moved the 4 with a question mark down to the top of the red rising flag. In these big consolidation patterns you will always see some type of reversal pattern form at the reversal points. As you can see reversal point #1 started out with a little unbalanced double bottom that worked into an inverse H&S bottom. Reversal point #2 built out a H&S top. Our last bottom,#3 started out with another small double bottom that ended up being the head of the inverse H&S bottom. Now here we are back up toward the top of the trading range where the price action has fallen short of reaching the price target of 1430, and has just built a 5 point bearish rising red flag. Is this going to be the reversal pattern that puts in the 4th reversal point in this nearly 9 month trading range?
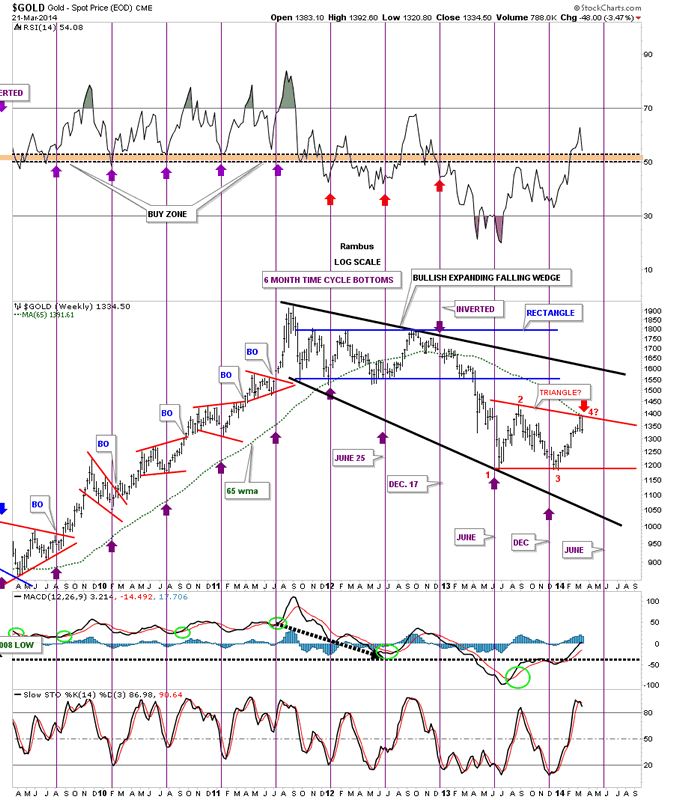
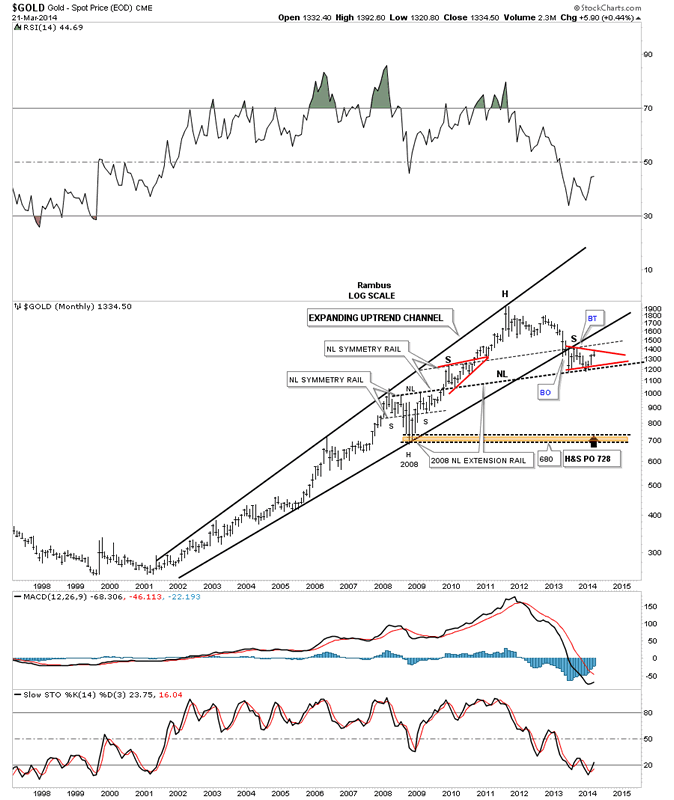
This next chart shows where the green 65 wma and the most recent high touched, red arrow. That 65 week moving average always worked as support during the bull market years. Is it now going to reverse its role and act as resistance during the bear market? Sometimes it can be too painfully easy not to pay attention to something, as simple as a moving average, that worked miracles during the bull market years. Sometimes it can be that easy. Also if this is the 4th reversal point in the red triangle we are catching it at the optimal time to take advantage of a move down to at least the bottom red rail. If gold can takeout the top red rail and the 65 wma to the topside then we’ll know right away that gold is much stronger than what it appears right now.
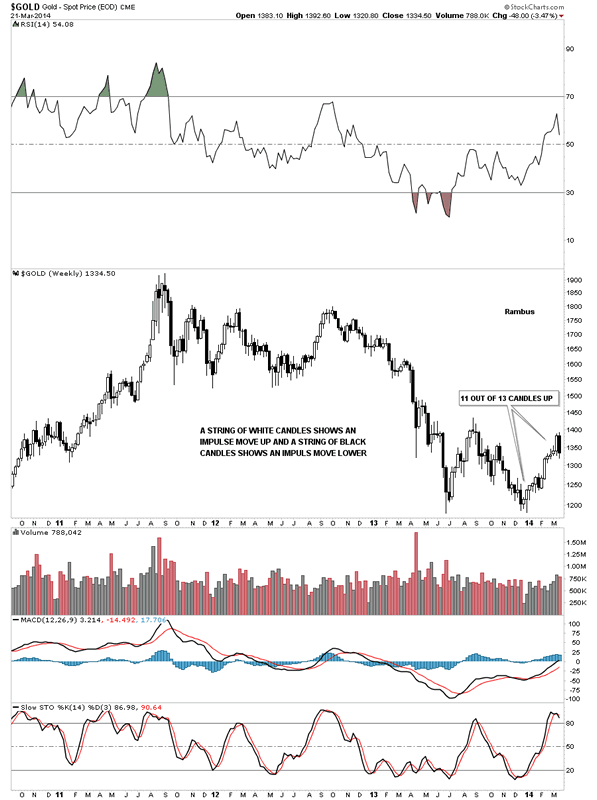
If gold is topping out right here we should see another black candlestick show up this week. There could be some volatility during the week but I would like to see a black candlestick form by the end of this weeks trading to add a little more weight to a downside move beginning.
If gold is actually building out a triangle consolidation pattern then that means the neckline of the very large H&S top will be broken to the downside. The neckline is still quite a ways down around the 1200 area so there is plenty of time to watch how things unfold over the coming weeks and months.
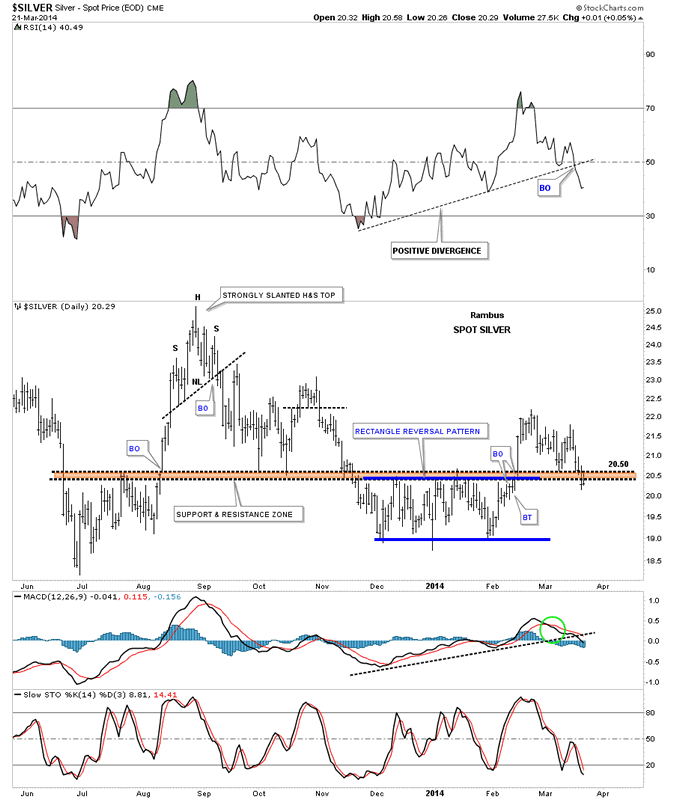
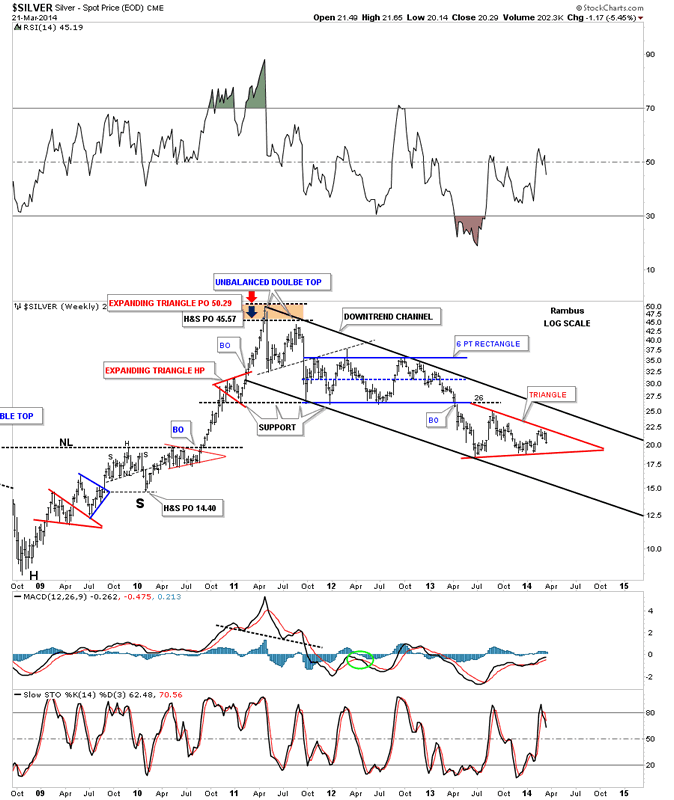
Lets take a look at silver that is starting to crack the strong area of support we’ve been watching at the 20.50 area which is the top of the blue 5 point rectangle reversal pattern. You can see the price action came down to the top of the support and resistance zone and had a good bounce but ran out of steam and now silver is starting to penetrate that brown shaded support and resistance zone which it shouldn’t be doing. The situation can still be saved if silver can start to rally strongly from here but support is starting to crack.
Below is another weekly chart I’ve been showing you that has the lite blue arrows that shows the mid rail support and resistance areas. As you know I’ve been watching that 20.50 area like a hawk hoping it would hold support. As you can see it closed the week below that critical mid line of support. I’ve added a red arrow that shows what happened the last time the center rail failed to hold support on the 6 point rectangle consolidation pattern above. That red arrow, on the blue 6 point rectangle, is the actual spot that began the big impulse leg down to eighteen. Is our current failure to hold support at the center dashed line the actual beginning of the next impulse leg down similar to what we seen on the blue rectangle?
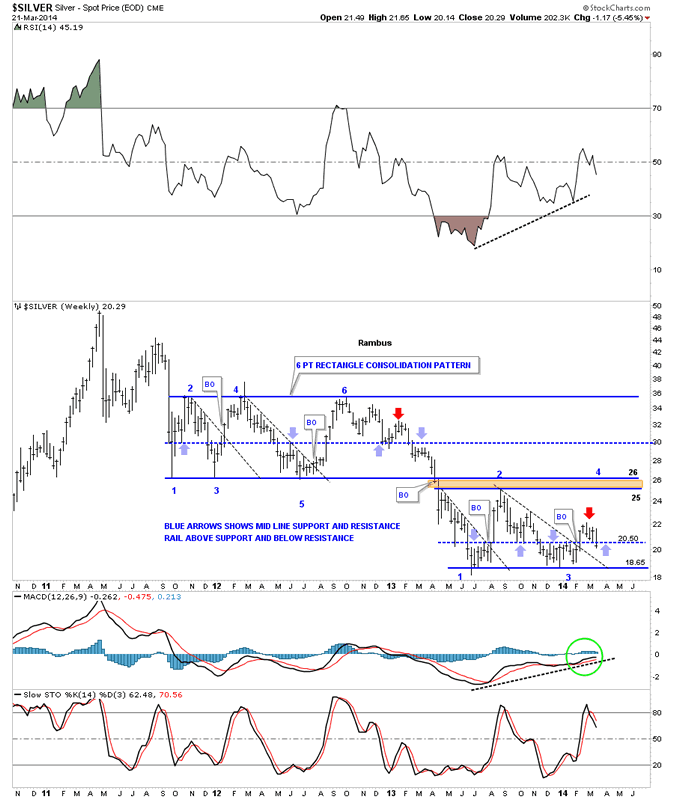
With the potential support rail being violated this sets up the possibility that a triangle pattern is now forming. I can guarantee you that this possible triangle is not on anyone’s radar screen yet. The fourth reversal point is now just beginning to show itself.
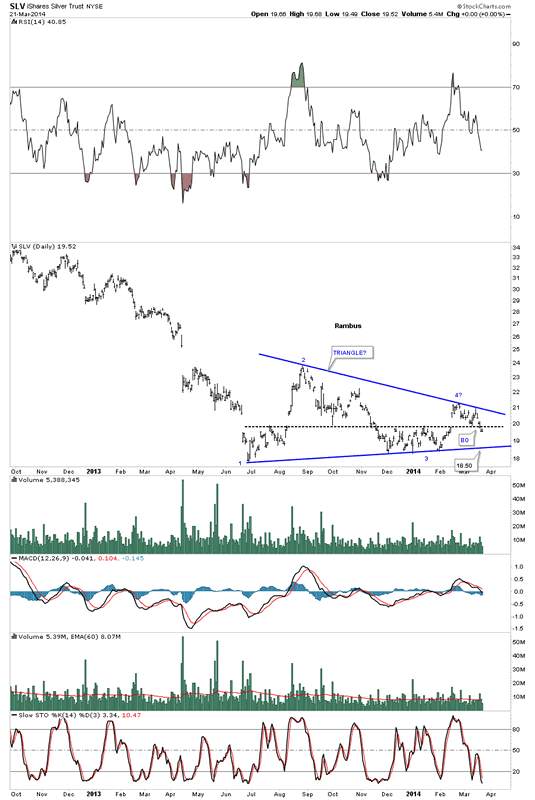
If silver is building out a triangle consolidation pattern lets see how it fits into the big downtrend channel that has been in place since silver topped out in April of 2011 almost three years ago already. As you can see it fits perfectly.
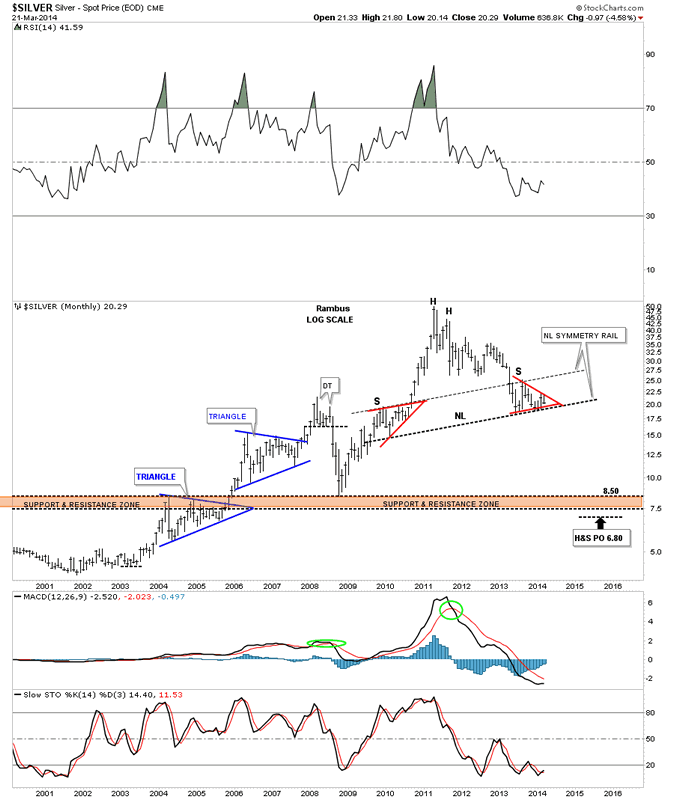
Lets take one last look at silver that shows how our potential triangle, that is now forming, may play out in the very long term look. As I’ve stated several times there is some beautiful symmetry is taking place on the long term monthly chart for silver. As you can see on the chart below the potential triangle is the right shoulder of a very large H&S top. I know it maybe hard to wrap your head around what this means for silver and the precious metals complex in general. If silver along with gold break below their respective necklines, I’ve been showing you, there is going to be one more hard down phase that will virtually wipe out most of the bull market gains off the books. This would then be a round trip from start to finish. How many investors do you think sold all their gold and gold shares in 1980 when gold and silver topped out? I would bet very few actually sold anywhere near the top as the same hype we have heard in this bull market was the same back then. Maybe this time will be different but silver and gold will need to show us some strength by making a new higher high at some point to reverse this downtrend that has been in place for close to three years now.
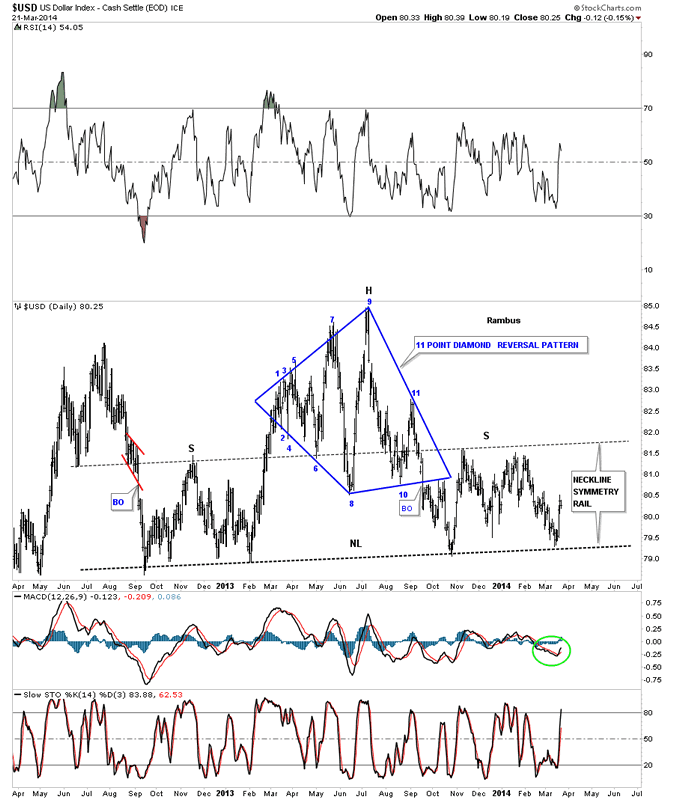
If gold and and silver are going to make new lows we need to look at the US dollar for any clues it can give us. The first chart I would like to show you is the possible H&S top with the Diamond head. As you can see the price action reached the neckline again just recently and has bounced up. We know that is one hot neckline. Still no confirmation that the potential H&S top is valid.
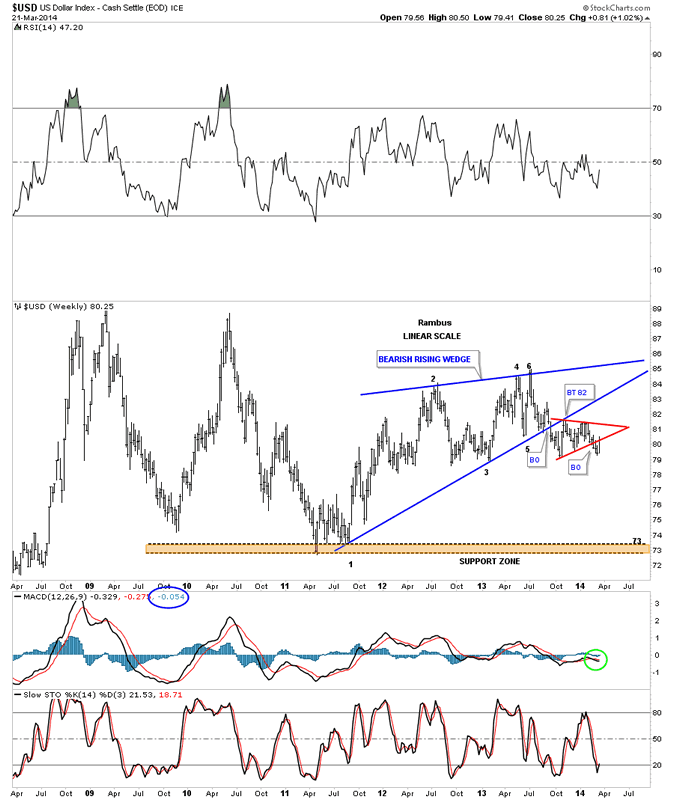
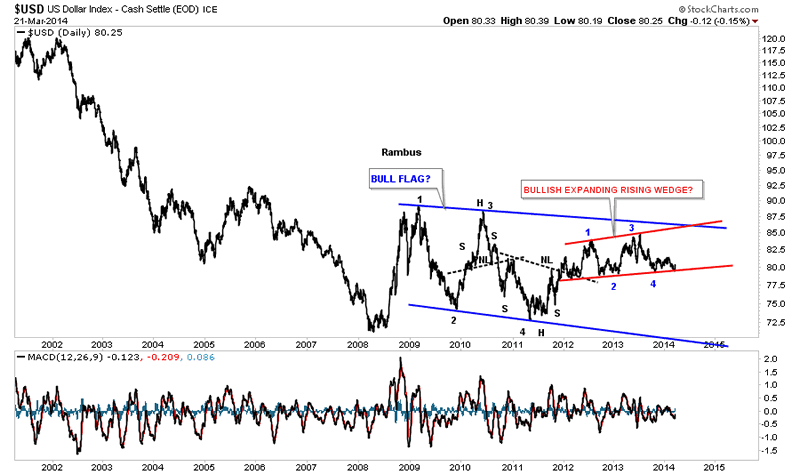
I have many charts for the US dollar that can show either a bullish or bearish outcome. Lets look at one more chart that shows a bearish setup. The US dollar broke down out of a blue bearish rising wedge and then built a red triangle as the backtest. You can see the dollar backtested the bottom rail of the red triangle this week. So far it’s still holding resistance.
Now lets look at several charts that may show a positive outcome if support can hold. Below is a very long term chart for the US dollar that is showing a possible very large blue triangle forming. If the bottom rail of the red consolidation pattern can hold support, right here, then the US dollar should be able to rally at least back up to the top red rail at a minimum. This is a critical time for the US dollar.
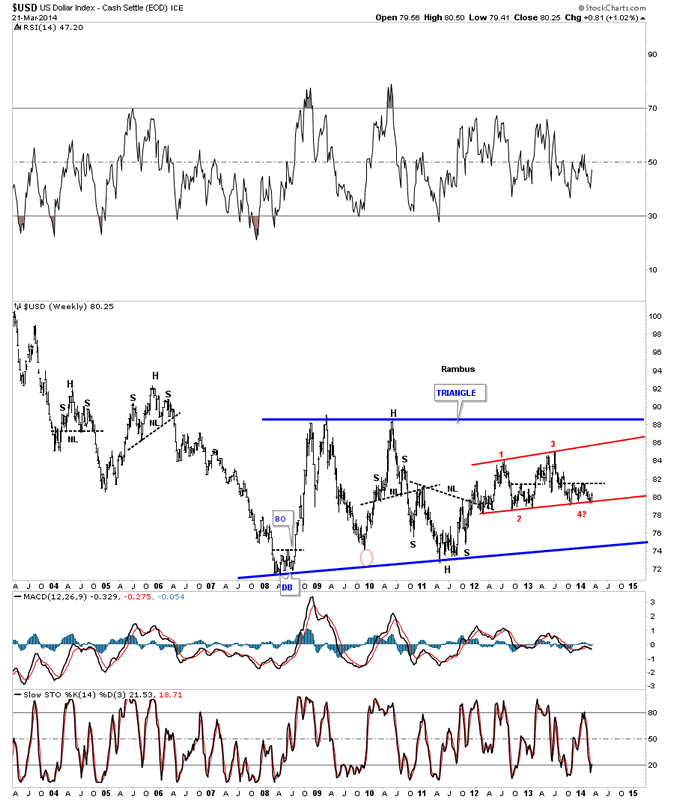
Below is basically the same chart but this time I moved the first reversal point up to the 87 area which gives us more of a bull flag type pattern. The red trading range is still the key as to which way the US dollar is eventually going to break. So far the bottom red rail has been holding strong support.
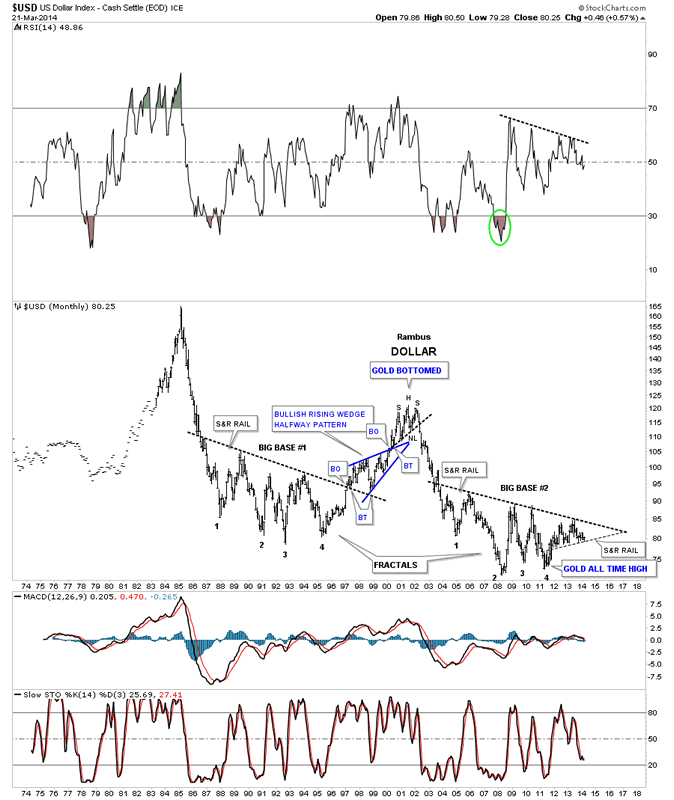
This last chart I would like to show you is one I built quite awhile ago that shows the two fractals or big base #1 and big base #2. The dollar has been moving at a snails pace between the top down sloping rail and the support and resistance rail on the bottom. Eventually it’s going to have to break one way or the other and whichever way it breaks out a good trend should develop.
It looks like the precious metals complex maybe at another inflection point right here and now. Last weeks price action may have ended the three month rally that began at the December low. I think we’ll know shortly if this is indeed the case. Stay tuned as it can get pretty wild at these turning points sometimes. All the best...Rambus
All the best
Gary (for Rambus Chartology)
FREE TRIAL - http://rambus1.com/?page_id=10
© 2014 Copyright Rambus- All Rights Reserved
Disclaimer: The above is a matter of opinion provided for general information purposes only and is not intended as investment advice. Information and analysis above are derived from sources and utilising methods believed to be reliable, but we cannot accept responsibility for any losses you may incur as a result of this analysis. Individuals should consult with their personal financial advisors.
© 2005-2022 http://www.MarketOracle.co.uk - The Market Oracle is a FREE Daily Financial Markets Analysis & Forecasting online publication.