


Gold Threatens Break of $870 to Trigger Long-term Bear Signal
Commodities / Gold & Silver Apr 27, 2008 - 11:45 AM GMTBy: Merv_Burak

That was another week we could have done without. Gold and gold stocks seem to be sitting on top of support levels. This next week just might be a very interesting week as far as telling us if the downside continues or if we may see a rise.
GOLD : LONG TERM
The long term P&F chart, shown in these commentaries a few weeks back, has now come back to the $885 level, where it rallied from earlier. However, a further drop to $870 will break below its up trend line and two previous lows to give us a long term BEAR signal. Should that happen the previous projections would become operative with an initial move to $840 and then on to $660. This new move, should it occur, would provide a further projection to $600, so we have potential projections all over the place, and all of them would be P&F valid IF gold should drop to the $870 level (based upon the June 2008 futures contract). Sounds ominous but let's see what the normal charts and indicators are telling us.
Using a daily chart and daily versions of the indicators (as opposed to the weekly variety in the Gold Indices Table at the end of the commentary) we see gold sitting almost on top of its still positive sloping moving average line and as the P&F chart showed, at a support level from the previous low in late March. The long term momentum indicator is still a comfortable distance above its neutral line. It is, however, below its trigger line and heading lower, in fact it is showing significant weakness having already moved below its late March low and is at a level not previously reached since last September. The volume indicator, which seemed to be holding steady for some time, has now gone into a downward spiral and well below its trigger line and its previous late March low. All in all, I would still rate the long term indicators as BULLISH at this time but that could change fast as things get more negative.
It should be noted that the rating in the Table has turned NEG (or BEARISH) this week. This is due to the use of a slightly more aggressive long term moving average line and a proprietary momentum indicator that is slightly more aggressive than the RSI that I use for the commentary analysis. I have found the Table to give a ratings change a week or two before my own analysis because of this BUT along with the more aggressive nature of the indicators is a somewhat higher risk of a whip-saw potential. Whether one goes with the charts and indicators or the Table, one would not be considering purchases of gold at this time, at least not until better indications of a reversal are shown.
VERY LONG TERM
Readers of these commentaries might remember the very long term chart and analysis shown here a couple of weeks back. To confuse the analysis we are still far from any reversal of the very long term trend.
INTERMEDIATE TERM
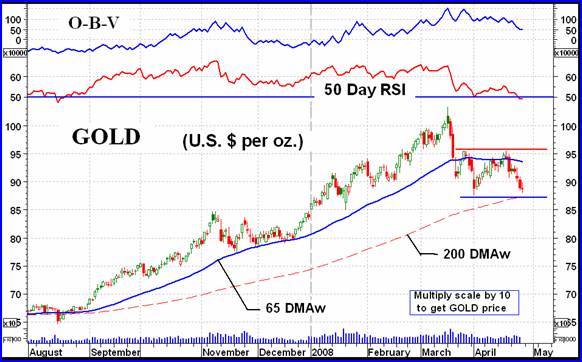
Although it looks like gold is just about on top of a support level the momentum and volume indicators suggest weakness that may just drive gold below support. Gold is already below its intermediate term moving average line and worst still, the line has now turned downward. The momentum indicator continues to head lower and is now below its neutral line in the negative zone for the first time since the rally started in August. The volume indicator seemed to have stabilized for a while but lately has turned sharply downward and is now considerably lower than its level during the late March lows. What all this seems to be saying is that the support from the late March lows may not hold. Should the support not hold then the analysis in the long term section will most likely take hold. For now the only rating I can give the gold intermediate term position is BEARISH .
SHORT TERM
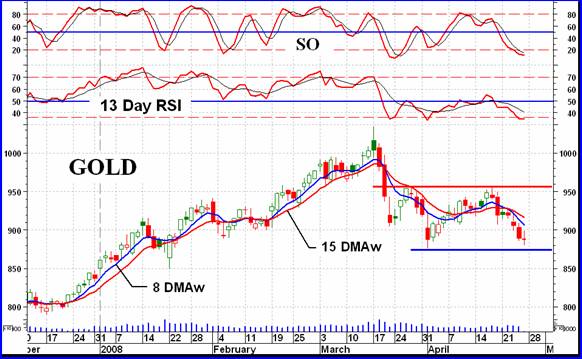
It was almost all down hill all week with the indicators following along. For the past five weeks or so gold has been boxed inside parallel support/resistance lines and is now at the support line. The price is below its short and very short term negative sloping moving average lines with the very short term below the short term. This suggests a negative move in progress. The short term momentum indicator is in its negative zone and below its negative trigger line. I have drawn a new negative oversold line on the indicator. Usually, with this indicator, the overbought and oversold lines are at 70% and 30% (i.e. 20% about the neutral 50% line). I thought that a better lower line should be at 35.7%. I wouldn't go into the explaination but there is a good one. At this higher oversold line we see that the indicator had crossed the line twice before in the recent past and bounced up. Are we ready for a bounce?
Despite the very good possibility that a bounce is just about due I must still go with the indicators as they are right now and maintain a BEARISH short term rating.
We see that the aggressive Stochastic Oscillator (SO) is in its oversold zone and starting a turn around, closing in on its trigger line. This suggests that the very short term strength of the gold move may be firming up and possibly getting ready for a rally. This is another indication of a possible rally ahead. However, the immediate direction of the action is still towards the down side so assuming a rally is eminent would be jumping the gun here. The immediate direction remains towards the down side until the more aggressive indicators have confirmed otherwise.
SILVER
Although silver at times acts better and at other times worse than gold the two seem to be trending together. They have very similar chart patterns and there indicators for the various time periods are almost identical, at this time. We even have a similar “box” pattern as gold. So, everything that was said about the direction and ratings for gold above is applicable to silver.
PRECIOUS METAL STOCKS
A couple of weeks ago I showed the very long term chart of the Merv's Gold & Silver 100 Index (see archives in most web sites). This Index is composed of the 100 largest gold and silver stocks traded on the North American markets, by market value. The Index is also calculated based upon the AVERAGE performance of all component stocks without placing any weighting on the largest stocks as all of the major Indices do.
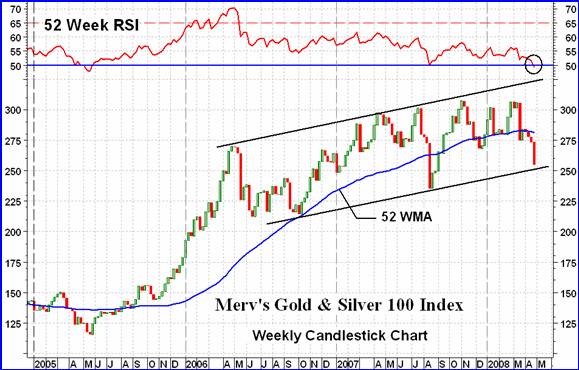
There were several features of this Index talked about at that time. Today I just want to focus on two. As shown in the earlier chart the very long term momentum indicator had been in the positive zone since late 1999, except for the short period in 2005 shown here. The indicator has also been steadily getting weaker ever since reaching its peak in 2002. The momentum indicator has once more dropped into the negative zone this past week. Now the question is, will this be another 2005 or is this the start of a new very long term bear market?
The very long term moving average line has also been sloping positively ever since it first turned up in 1999, again except for that period in 2005 when it was basically sloping very gently lower. Over the past three weeks the moving average has tuned downward and by this week its downward slope is in the most aggressive downward path since 1999.
There is an old concept in the industry that says at a market top the first stocks to turn lower are the dogs. The “quality” are the last to turn. My Index of gambling stocks, the Merv's Gamb-Gold Index is in a real solid bear market and as the ratings in the Table suggest, are the worst performers of the bunch. The highest “quality” stocks, those in the Merv's Qual-Gold Index, are doing the best of the Merv's Indices but even here they are in a bear market already.
Again I emphasize that the Merv's Index represents the AVERAGE performance of its component stocks, not just the heavily weighted few largest stocks in the Index.
So, are we at the early stage of a major bear market or just a very frustrating rest period of a continuing bull market? Those following the technical discipline should have been out of the market some time ago and just relaxing and taking it easy, waiting for the technicals to turn around again. Those following the fundamental discipline are probably all over the place depending upon the view of their individual advisor.
I think it was J.P. Morgan who, when asked over 100 years ago what an investor should do said, “SELL TO THE SLEEPING POINT”, which is always good advice for your mental health.
Merv's Precious Metals Indices Table
Well, that's another week.
By Merv Burak, CMT
Hudson Aero/Systems Inc.
Technical Information Group
for Merv's Precious Metals Central
For DAILY Uranium stock commentary and WEEKLY Uranium market update check out my new Technically Uranium with Merv blog at http://techuranium.blogspot.com .
During the day Merv practices his engineering profession as a Consulting Aerospace Engineer. Once the sun goes down and night descends upon the earth Merv dons his other hat as a Chartered Market Technician ( CMT ) and tries to decipher what's going on in the securities markets. As an underground surveyor in the gold mines of Canada 's Northwest Territories in his youth, Merv has a soft spot for the gold industry and has developed several Gold Indices reflecting different aspects of the industry. As a basically lazy individual Merv's driving focus is to KEEP IT SIMPLE .
To find out more about Merv's various Gold Indices and component stocks, please visit http://preciousmetalscentral.com . There you will find samples of the Indices and their component stocks plus other publications of interest to gold investors.
Before you invest, Always check your market timing with a Qualified Professional Market Technician
Merv Burak Archive |
© 2005-2022 http://www.MarketOracle.co.uk - The Market Oracle is a FREE Daily Financial Markets Analysis & Forecasting online publication.