


Three Breakouts in Gold and Silver Stocks
Commodities / Gold and Silver 2014 Mar 17, 2014 - 06:33 AM GMT

 I’ve shown you several comparison charts with the HUI, GLD and SLV that shows they all tend to breakout at roughly the same time. One can sometimes be stronger than the others but they tend to breakout at the same time. This week was no exception. All three broke out of their consolidation patterns this week. Who would have thunk it.
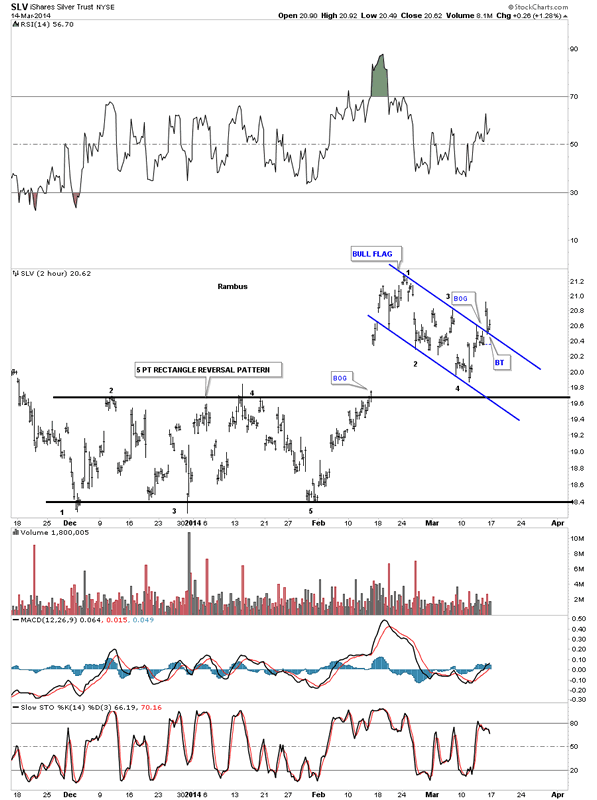
First, lets look at SLV that shows the bull flag we’ve been following since SLV broke out from the 5 point rectangle reversal pattern. Yesterday the price action hit the top blue rail and fell back, just as you would expect on the inital hit. The question was how many bears were on the other side of that top blue rail? Today answered that question without a doubt. The big gap up this morning told us the bears were gone and they are now in retreat looking for new high ground they will try to defend. Below is a 2 hour 4 month chart for SLV that shows the breakout today and the backtest.
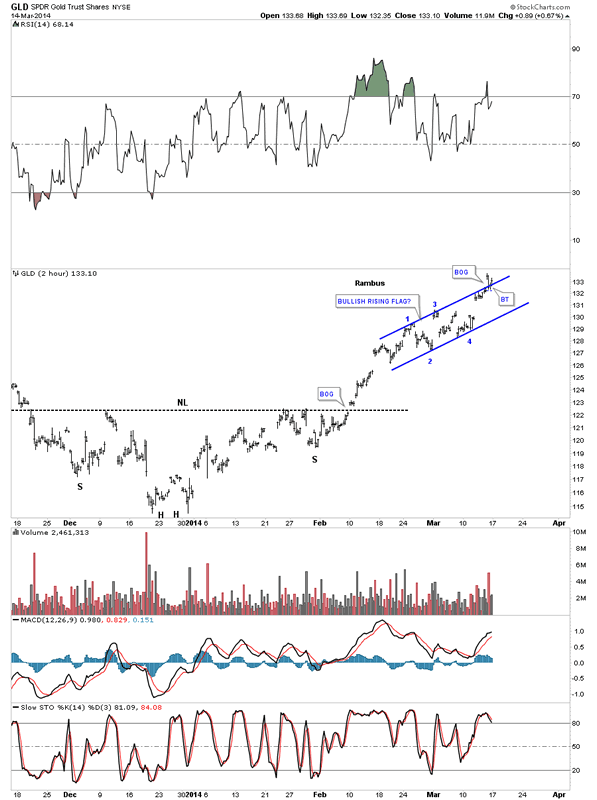
Below is a 2 hour 4 month chart for GLD that looks totally different than the SLV chart. They are different but similar if you look at the base or reversal patterns and the consolidation patterns. Here you can see GLD formed an inverse H&S bottom as its reversal pattern. As we all know gold has been stronger than silver so we should look for a strong consolidation pattern. The strongest consolidation pattern that I know of, and nobody recognizes them, is a consolidation pattern that points in the same direction as the trend. As you can see on the SLV chart above the bull flag slopes down against the uptrend. This is what a normal consolidation pattern looks like. When a stock is in a very strong trend it will slope with the trend instead of against it.
Today GLD gapped above the top rail of it bullish rising flag consolidation pattern and did its backtest just as SLV did.
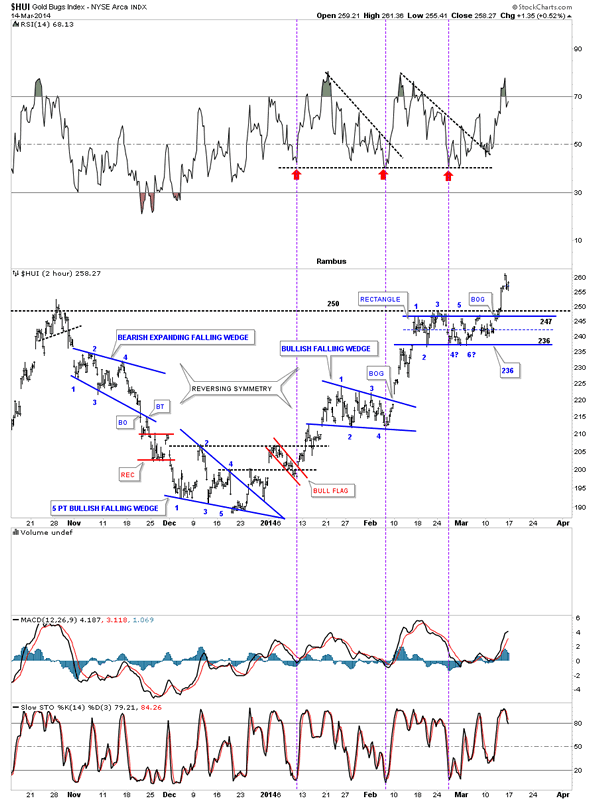
Below is a 2 hour 5 month chart for the HUI. The last time I showed you this chart we were looking for the 6th reversal point as shown by the 6 with a question mark. As you can see the HUI rallied back up to the top blue rail and declined back down about half the length of the rectangle where it found support. That’s all the strength the bears had left so the bulls wasted little time in taking control of the situation. The bears are exhausted and need a new area to defend. The bulls gapped out of the rectangle and are now above horizontal resistance. Folks, from a Chartology perspective, it just doesn’t get any prettier. At some point we’re going to see a consolidation pattern form that will be much bigger than these little ones that have built out so far.
If you recall I mentioned how we were reversing symmetry backup vs how we came down. With more time on this chart now you can begin to see the reverse symmetry taking hold as this rally progresses. I’ve labeled all the reversal points so you can see the battle that goes on between the bulls and the bears. Each reversal point is a skirmish and when the consolidation pattern finally breaks, to the victor goes the spoils. You can see the bears were in control on the way down but since the blue 5 point bullish falling wedge reversal pattern broke to the upside the bulls are now in control.
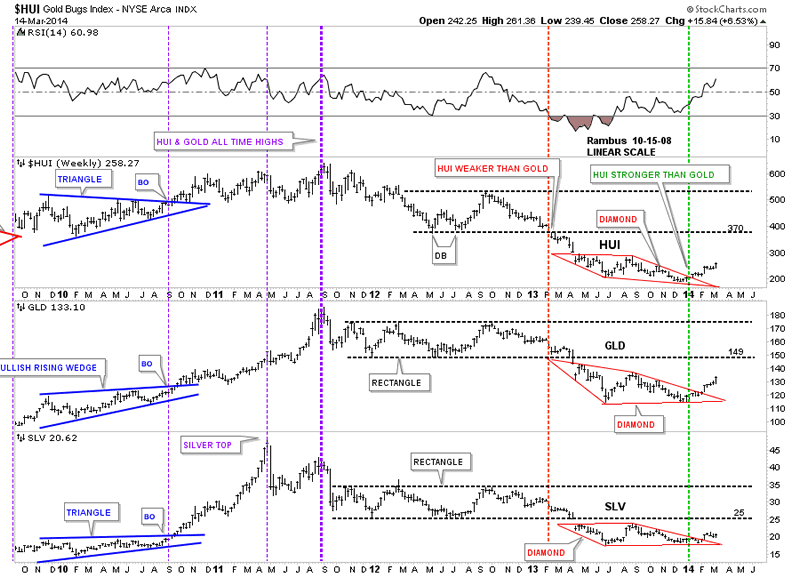
Weekly comparison chart.
In my humble opinion you can spend every waking minute trying to figure out why is gold and and PM stocks going up. Is it because of inflation, deflation, copper, the stock markets, currencies , War or a hundred different reason’s? If you just follow the price action and devote the time spent trying to find a reason for why, you will be way ahead of the game. You don’t have to know the answer to the question everybody is trying to answer. It’s irrelevant. The answer is right there in front of you if you take the time to understand what the chart is telling you.
All the best
Gary (for Rambus Chartology)
FREE TRIAL - http://rambus1.com/?page_id=10
© 2014 Copyright Rambus- All Rights Reserved
Disclaimer: The above is a matter of opinion provided for general information purposes only and is not intended as investment advice. Information and analysis above are derived from sources and utilising methods believed to be reliable, but we cannot accept responsibility for any losses you may incur as a result of this analysis. Individuals should consult with their personal financial advisors.
© 2005-2022 http://www.MarketOracle.co.uk - The Market Oracle is a FREE Daily Financial Markets Analysis & Forecasting online publication.