


How to Detect Stock Market Tops
InvestorEducation / Technical Analysis Feb 20, 2014 - 04:18 PM GMTBy: Investment_U

 Chris Rowe wites: As I noted last week, bull market tops are often characterized by a breakdown of the sector that had led the market higher (like tech stocks in 2000 or financial stocks in 2007).
Another clue in our hunt for the top is the concentration of leadership to individual sectors. When we get near major (or even intermediate) bull market tops, we tend to see one sector (or sometimes two related sectors) breaking clearly away from the others.
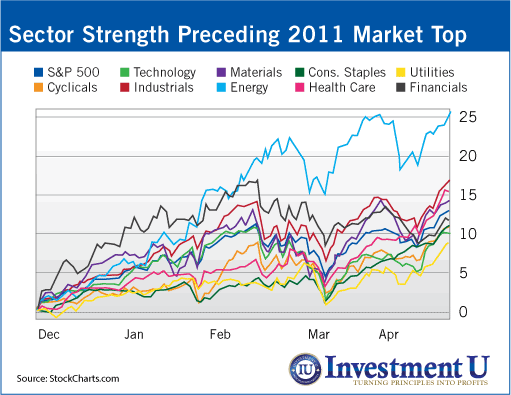
Take 2011, for example, the year S&P 500 large caps dropped 19.4% and the Russell 2000 small caps tanked 29.6%.
Concentration of leadership in one sector was present in the six months prior to the market’s tumble.
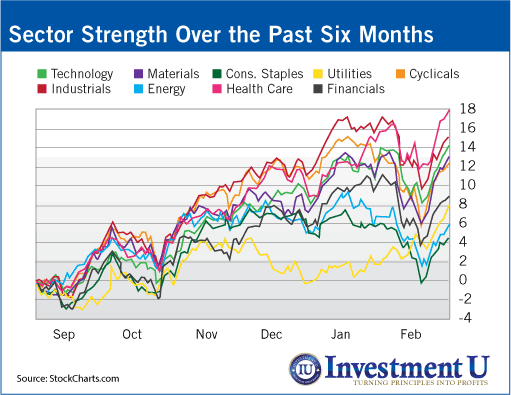
The market topped on April 29, 2011. Below, you can see that in the six months preceding the fall, the energy sector broke away from the other sectors by more 10% on average.
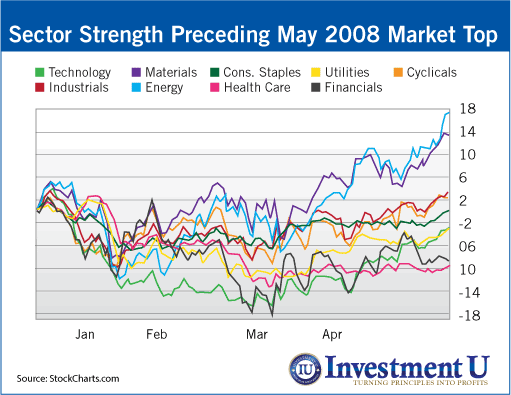
Below, we see the leadership was concentrated in the energy and materials sectors – basically, commodities. These sectors were up nearly 18% and nearly 14%, respectively, over the six months prior to May 19, while most other sectors were down or up minimally.
Because energy stocks had enjoyed a stellar performance from 2002 to 2007, one may think it impossible to use a concentrated-leadership analysis as a significant clue of a top.
Not the case.
Although the energy sector did outperform other sectors for much of the bull market, when I randomly studied multiple six-month time frames that ended with the general stock market charging higher – but not close to a top – the energy sector blended right in with the other sectors’ performance.
When it diverged far above the other sectors was when the market was nearing its top.
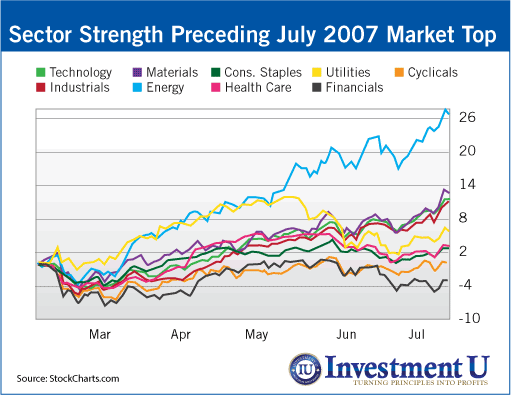
That’s what we saw leading up to the July 16, 2007, bull market top.
During the six months prior to that date, energy was up 26%, while none of the other major sectors were up more than 13%. Over the following month, the market shed 9.22%.
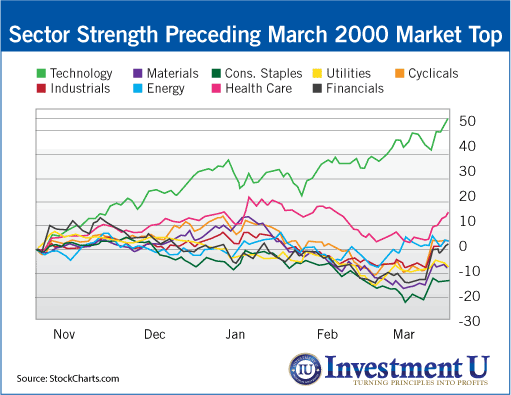
The tech sector was almost 55% higher in the six months prior to March 2000, while every other sector was roughly flat or down.
We have certainly seen some market weakness in the intermediate term. But we must remain long-term bulls until we see much more evidence of a long-term top, such as significantly concentrated leadership.
Long-term tops take a long time to form so there will be plenty of time to adjust accordingly as they unfold. Over the last couple of months the market has only been punished like a misbehaving child.
In future articles I’ll update you when we see significant concentration of leadership into any single sector. For the intermediate term you’ll want to trade a bit more cautiously than in 2013.
Good investing,
Chris
Source: http://www.investmentu.com/2014/February/how-to-detect-stock-market-tops.html
Copyright © 1999 - 2013 by The Oxford Club, L.L.C All Rights Reserved. Protected by copyright laws of the United States and international treaties. Any reproduction, copying, or redistribution (electronic or otherwise, including on the world wide web), of content from this website, in whole or in part, is strictly prohibited without the express written permission of Investment U, Attn: Member Services , 105 West Monument Street, Baltimore, MD 21201 Email: CustomerService@InvestmentU.com
Disclaimer: Investment U Disclaimer: Nothing published by Investment U should be considered personalized investment advice. Although our employees may answer your general customer service questions, they are not licensed under securities laws to address your particular investment situation. No communication by our employees to you should be deemed as personalized investment advice. We expressly forbid our writers from having a financial interest in any security recommended to our readers. All of our employees and agents must wait 24 hours after on-line publication or 72 hours after the mailing of printed-only publication prior to following an initial recommendation. Any investments recommended by Investment U should be made only after consulting with your investment advisor and only after reviewing the prospectus or financial statements of the company.
Investment U Archive |
© 2005-2022 http://www.MarketOracle.co.uk - The Market Oracle is a FREE Daily Financial Markets Analysis & Forecasting online publication.