


Fiat Money Implications for Gold and Silver
Commodities / Gold and Silver 2014 Jan 24, 2014 - 03:58 PM GMTBy: Alasdair_Macleod

 By December, the most recent month for which statistics are available, the US dollar Fiat Money Quantity (FMQ) had grown to $12.48 trillion. This is $5.05 trillion more than if it had grown in line with the established average monthly growth rate from 1960 to the month before the Lehman Crisis. By this measure of currency inflation, since August 2009 inflation is now 68% above trend. This is illustrated in Chart 1 below.
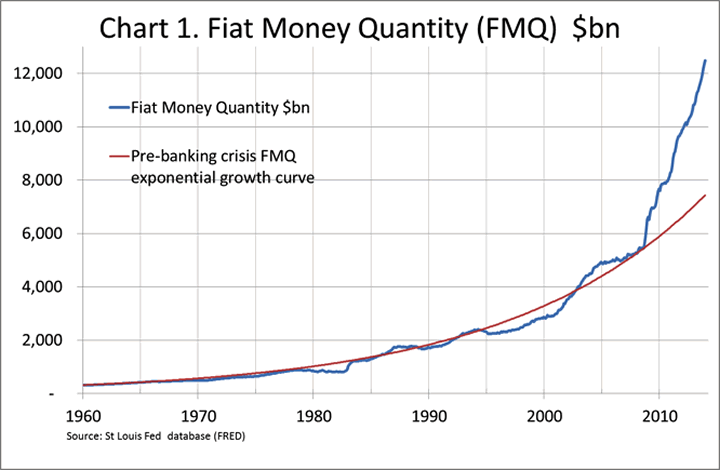
FMQ measures the difference between currency, measured by cash and deposits, and sound money by retracing the evolution of currency from gold and fully-backed gold substitutes. It is therefore fundamentally different from conventional measures of money supply, which compare changes in themselves over time. Instead it is a comparison between sound and unsound money.
Estimating monetary tightness Since January 2013 quantitative easing (QE) of $85bn has been the principal driving force behind FMQ, at double the rate of the increase in bank reserves held at the Fed with respect to purchases of Treasuries from the primary dealers. This is because the Fed buys them from primary dealers, crediting their banks with reserves on its own balance sheet, and the primary dealers are in turn credited with deposits at their banks. Alternatively when the Fed buys mortgage assets this can also be regarded as creating deposits at both the Fed and at the banks, though there may be some timing differences involved between when banks first acquire and then subsequently sell their own assets to the Fed.
The approximate effect of QE on overall liquidity is therefore captured by taking twice the monthly QE and then subtracting the increase in FMQ, so we can estimate how dependent markets have become on QE. Note that QE is not the only determinant of monetary liquidity. The result is shown in the next chart.
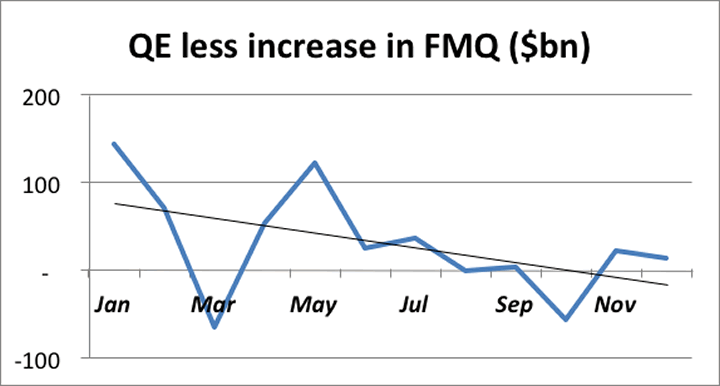
At the beginning of 2013 QE was significantly greater than required by the banking system. With the exception of the March aberration (month-to-month increases in FMQ can be volatile), the Fed’s QE policy injected more fiat money into the economy than the economy actually needed, which is consistent with the Fed’s objective to kick-start the economy. This is reflected in the linear trend line which early in the year was significantly positive. Gradually however the financial system has adjusted to QE with nearly all of it now required by the financial system. This is reflected in the linear trend line which has now moved into negative territory.
Put another way, the excess liquidity injected by the Fed through QE is now being used up in the banking system. Therefore, the $10bn reduction in QE announced in December’s FOMC minutes, in the absence of other liquidity measures provided by the Fed, can be expected to eventually put pressure on overnight rates to rise as bank lending increases.
The most important factor for the Fed in deciding the extent of QE has most likely been the growth in bank lending. The next chart shows an approximation of bank lending by subtracting M1 from M2.
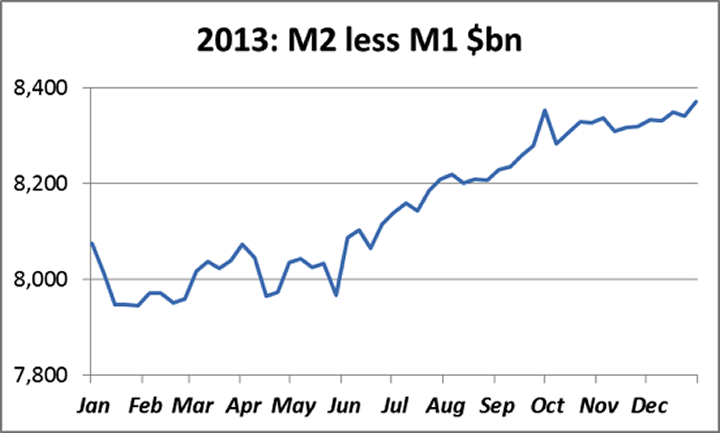
The fall in bank lending early in the year was the principal factor behind the introduction of QE3. The mid-year recovery in bank lending coincided with the Fed’s introduction of possible tapering into public debate, leading to the eventual decision to taper taken at the December FOMC meeting.
Repurchase agreements (reverse repos and repos)
At the year-end the Fed temporarily reduced its holdings of Treasury paper through reverse repurchase agreements totalling $316bn. This appears to have been driven at least partly by the Fed’s desire to put a floor under interest rates by draining temporary liquidity from the banks, possibly the result of year-end factors. Subsequently outstanding reverse repos have reduced by a third to $202bn.
The markets expect further reductions in QE in the coming months as bank lending continues to grow. For this to happen without tightening in the money markets, commercial banks will need to expand bank credit to compensate. In the event this is not forthcoming, rather than reverse the decision to taper QE, it is equally possible for the Fed to inject liquidity into the system through repos. Thus the replacement for QE could well turn out to be interest rate management by using repos to add liquidity and reverse repos to drain it.
In conclusion, the Fed does not have to rely on QE to maintain overall monetary growth.
Gold
The fourth chart shows the price of gold adjusted for the increases in FMQ and above-ground stocks of gold since January 1960, when gold was fixed at $35 (yellow line) compared with the nominal dollar price (red line).
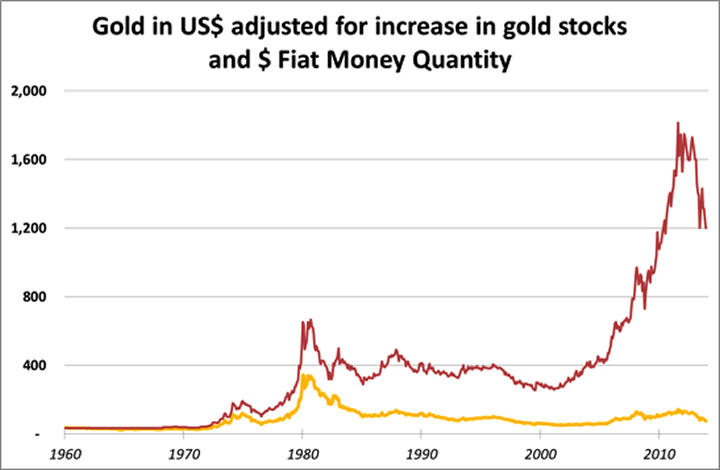
At $1200 nominal, which was the gold price on 31 December 2013, the adjusted price is $76, slightly more than double the price in 1960 US dollars. We cannot put together the components of FMQ before 1959 because the statistics are not available, but at that time FMQ was similar in quantity to the discontinued M3 series at $292bn and $300bn respectively. M3 in 1933, when gold was revalued to $35, stood at $41.53bn[i] <#_edn1> , and above-ground gold stocks increased from 35,327 tonnes to 60,137 tonnes between 1933 and 1959. So measured in 1933 FMQ dollars the price of gold adjusted for the increase in above-ground gold stocks today is approximately $6.72.
The next chart shows gold in 2000 US dollars rebased to 100.
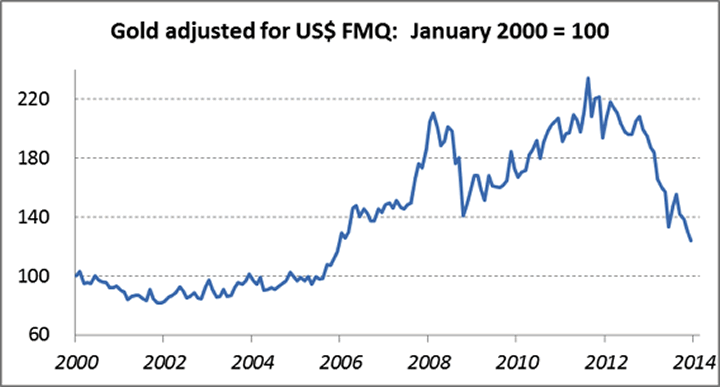
In these adjusted terms gold at $1200 nominal in December 2013 is 124% of its price in January 2000. At that time equity markets were in a bubble to rival the South Sea of 1725, systemic risk was the last thing on investors’ minds, and FMQ has since hyper-inflated. Furthermore the gold price in 2000 reflected protracted bear market sentiment that had built up over two decades.
Therefore, based on gold prices from the 1930s onwards gold in real terms appears extraordinarily undervalued.
Silver
The last chart shows the price of silver adjusted for the increase in FMQ and rebased to January 2000.
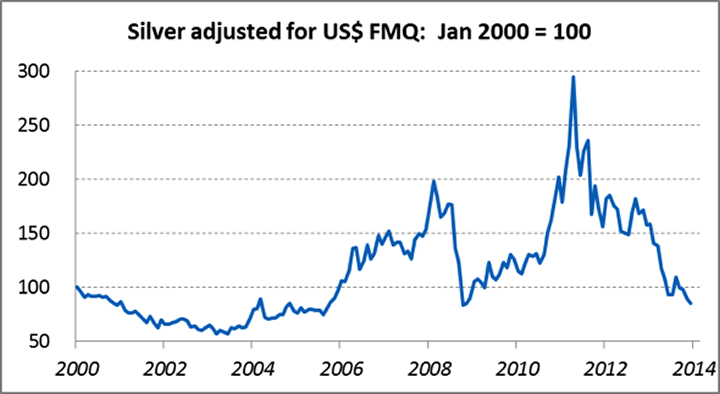
Since silver is mainly consumed as an industrial metal, and the strategic above-ground stocks accumulated in the last century are now depleted, it is not appropriate to adjust the silver price by changes in the quantity of silver when measuring it in FMQ terms. The adjustment over time is therefore entirely from the currency side. Taking this into account, the adjusted silver price at end-December is 85 on our index and so is at a 15% discount to the price at the beginning of January 2000, more than eliminating the price spikes in 2008 and 2011.
Alasdair Macleod
Head of research, GoldMoney
Alasdair.Macleod@GoldMoney.com
Alasdair Macleod runs FinanceAndEconomics.org, a website dedicated to sound money and demystifying finance and economics. Alasdair has a background as a stockbroker, banker and economist. He is also a contributor to GoldMoney - The best way to buy gold online.
© 2013 Copyright Alasdair Macleod - All Rights Reserved
Disclaimer: The above is a matter of opinion provided for general information purposes only and is not intended as investment advice. Information and analysis above are derived from sources and utilising methods believed to be reliable, but we cannot accept responsibility for any losses you may incur as a result of this analysis. Individuals should consult with their personal financial advisors.
Alasdair Macleod Archive |
© 2005-2022 http://www.MarketOracle.co.uk - The Market Oracle is a FREE Daily Financial Markets Analysis & Forecasting online publication.