Elliott Wave on Crude and the US Dollar
Currencies / US Dollar Apr 20, 2008 - 07:05 PM GMTBy: Dan_Stinson
 Short Term Forecast Update -
With a little more action in place, we have an update on the USD and Crude.
US Dollar
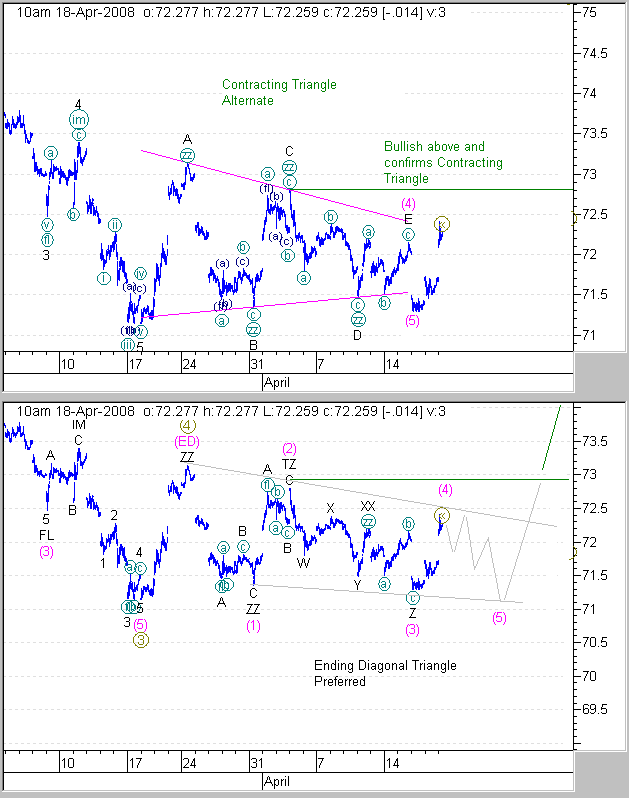
The USD appears as an ending diagonal triangle pattern, currently in wave 4 of wave (5). The last update indicated that the USD was possibly in a (contracting) triangle but it will likely complete as an (ending diagonal) triangle.
Contracting triangles and ending diagonal triangles are both very corrective patterns. The previous newsletter indicated that a possible triangle was in play and the pattern appears to have evolved into an ending diagonal triangle pattern. We have both possibilities illustrated in the animated chart below. The contracting triangle pattern would suggest the downside is complete, while the ending diagonal triangle indicates that one more wave down is expected to complete the pattern. A move above the green horizontal line would indicate that the contracting triangle is complete. We are expecting one more choppy wave down to the recent lows and this would indicate the ending diagonal pattern is completing. Ending diagonal patterns always end with sharp reversals to where the pattern began, so once it is complete, we can expect a sharp rally above 73.
Crude
The price action for Crude broke above the top trendline on the previous newsletter, which ilustrated a move to new highs in wave (5), which we have seen.
Once wave (5) completes, we should have an intermediate high in place for Crude and an intermediate low in place for the USD, before larger corrective patterns.
US Dollar

We can monitor these charts to confirm (or negate) the ending diagonal pattern. A break above the green horizontal line on the USD would suggest the contracting triangle pattern is complete. A decline back down to the lows would indicate that the ending diagonal triangle is completing.
These charts are only a guide so that you can follow the action and watch for the expected action in the triangle. The action could play out exactly as illustrated or it may need minor adjustments as we follow it through.
If you are interested in viewing these updated charts and other detailed charts with targets on a daily basis, please see the registration details below.
If you are interested in viewing these updated charts and other detailed charts with targets on a daily basis, please see the registration details below.
Elliott Wave Chart Site - IntraDay Market Updates on the DOW, Nasdaq, S&P500, Gold, Silver, HUI and the USD.
By Dan Stinson
http://www.e-wavecharts.com
Copyright© 2001-2008
The indices covered include the NASDAQ, DOW, S&P 500, Nikkei, and DOW Transports. Commodity charts include the CRB Index, Copper, Crude, Gold, Silver, HUI and the XAU (Gold and Silver index) . Additional Elliott Wave charts cover the US Dollar (USD),CAD, Euro, 10 Year Treasury Note Yield (TNX), Nortel, Ballard Power, EBay, Encana (ECA), North American Palladium, Gold Corp, Pan American Silver, Central Fund (CEF), Couer D Alene Mines (CDE), Newmont Mining (NEM), Agnico Eagle Mines (AEM) and Denison Mines.
Dan Stinson Archive |
© 2005-2022 http://www.MarketOracle.co.uk - The Market Oracle is a FREE Daily Financial Markets Analysis & Forecasting online publication.


