


UK House Prices Forecast 2014 to 2018, Inflation, Trend Trajectory and General Election 2015
Housing-Market / UK Housing Dec 30, 2013 - 04:52 AM GMTBy: Nadeem_Walayat

 Introduction: This analysis is part 2 of 2 that seeks to conclude in a detailed trend forecast for UK house prices that extends my existing forecast into Mid 2014 to the end of 2018, thus a 5 year forecast for UK house prices 2014-2018. This analysis is focused on the impact of the Inflation mega-trend on the prospects for UK house prices that concludes in a detailed trend forecast and its implications for outcome of the next general election.
Part 1 can be accessed here: UK House Prices Forecast 2014 to 2018, The Debt Fuelled Election Boom
Real UK House Prices and the Inflation Mega-trend
The latest inflation data shows CPI falling to 2.1% for November 2013 (RPI 2.6%, Real inflation 3.6%) which was received as good news as inflation was finally starting to home in on the Bank of England's 2% CPI target rate. This prompted the usual mantra amongst the academics of the risks of dis-inflation and in some cases even deflation which were coupled with benign inflation forecasts by government institutions such as the Bank of England and the OBR that repeated their forecast that UK inflation would resolve to 2% in 2years time that is always the case and I mean ALWAYS, for more than a decade now the Bank of England has been spouting the same mantra aimed at keeping the wage slaves sedated as the actual inflation graph below illustrates that in reality there is an over 90% probability for UK Inflation being significantly above 2% in 2 years time.
If you have been reading my inflation mega-trend series of articles this year, then you would know that I would not be surprised if UK inflation reaches as high as 7% in 2 years time! Which is well beyond anything in the collective consciousness of what passes for economic analysis from within ivory towers such as the OBR and a litany of economic Thick Tanks.
However, the inflation truth is far removed from that which the media focuses upon with the annual percentage rates of inflation that masks the truth of what is an exponential inflation mega-trend which is the primary consequences of perpetual money and debt printing monetization programmes that the government is engaged in, in an attempt to buy votes through high deficit spending, an inflation trend that asset prices are leveraged to and oscillate around which currently has UK inflation compounding at the rate of 2.1% per year that resolves in the following exponential trend.
The below graph again illustrates how much Inflation we have experienced that most people are likely unaware of is that of the loss of purchasing power of the British Pound which is now worth less than 40% of its value of 25 years ago as governments continue to relentlessly erode its value all the way towards zero.
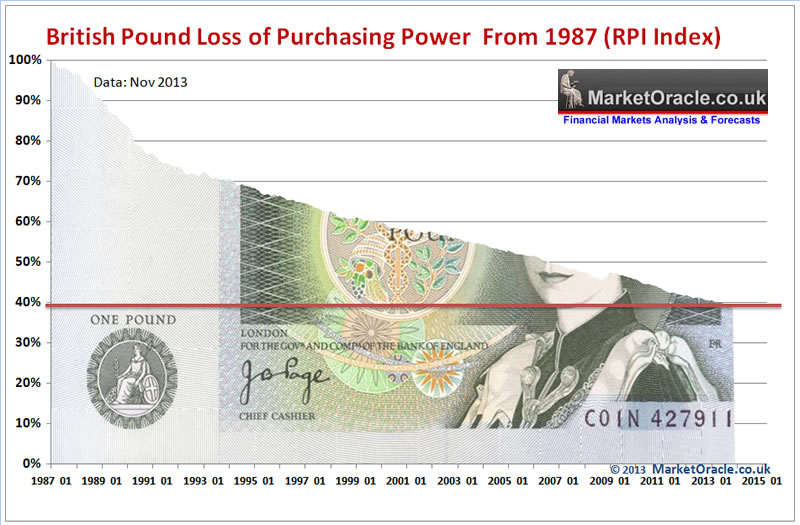
This IS the reason why your real experience of day to day living expenses does not match government / media propaganda. However, it is even worse because as I keep reiterating that the rate of Inflation is EXPONENTIAL. What this means is that if you stuffed money under your mattress 20 years ago, today it's value would have been inflated away by 50%.
The debt / money printing induced inflation mega-trend is forcing people to either spend or put their hard earned cash into the bankrupt banks for a pittance in interest that is TAXED, so that it is near impossible to consistently get a return that is greater than even the official rate of inflation let alone the real rate of inflation that is currently about 3.6%, as governments continuously tinker with the methodology to reduce the official inflation rate as you will likely experience when you go to do you weekly shops and experience inflation rates nearer to 9% then 2%.
The Great Savings Interest Rates Crash Continues
The below table for the cash isa rates as offered by the Halifax shows that savings interest rates crashed directly in response to the Bank of England's Funding for Lending Scheme announced in July 2012, which sought to provide the Banks with cheap money to encourage lending to the general public that originally would total an estimated £80 billion over 18 months but which subsequently was indefinitely extended. The effect of which has been for the Banks to rely on Bank of England / UK Treasury for funding of lending instead of savings and thus savings interest rates continue to crash despite a strengthening economy.

Just take a second look at this table at the degree of erosion of purchasing power from savers, even the long 5 year Halifax fix fails to match RPI of 2.6%, instead the rate paid is a pittance of 2.1% when it should be at least 4.5%! This is systemic banking system wide! This is why the banking system operates as a crime syndicate to systematically STEAL money from their customers be it LIBOR, PPI, SWAPS or PURCHASING POWER as a consequence of far sub inflation interest rates.
Furthermore, the Bank of England's recent announcement that it would restrict use of funding for lending to target businesses instead of mortgages has instead of increasing savings interest rates that the mainstream press ran with as the consequences of, instead has to date had the opposite effect of resulting in further cuts in the rates of interest.
Again, the consequences of the exponential inflation mega-trend stealth theft of savers wealth is worsened by the 20%-40% additional theft by means of double taxation on savings interest that ISA's at least attempt to protect against i.e. Inflation steals the value of your savings by currently about 1.5% then the government taxes you by 20% to 40% on the sub inflation interest rate that you will be in receipt of which means that savers are guaranteed to lose 2% of the value of savings per year which the following graph illustrates that over the past 5 years for the top 20% interest paying instant access accounts, on the CPI + tax measure over 8% has been stolen and on the real Inflation measure over 16% has been stolen.
To protect oneself from the global inflation war against savings, savers need to risks i.e. if you invest in the stock market then you need to appreciate the fact that it will be far higher risk than leaving it in the bank even if it WILL lose its value at approx 2% per annum even in the best instant access savings account. For much of 2012 and for the whole of 2013 I have been flagging that the UK housing market presents one of the best opportunities for not only protecting against the stealth inflation bankster and government theft but also by profiting from the inflation mega-trend.
UK House Prices and the Inflation Mega-trend
My analysis and concluding trend forecast of 3.5 years ago laid out the the implications of inflation for the UK house prices trend over subsequent years towards a housing market bottom as illustrated below -
17 Jun 2010 - UK House Prices Inflation Adjusted Long-term Trend Analysis
The implications of the real trend in UK house prices are:
a. The housing market is nowhere near reaching another boom phase which only coincides when house prices pass their previous peak in REAL terms i.e. after inflation, this suggests that any upward trend in house prices is going to be shallow where the next boom could be as long as a decade away.
b. That the housing market in real terms has barely lifted off of its March low and is thus highly susceptible to a prolonged period of stagnation in real terms, i.e. the housing market basically goes nowhere for several years in real terms.
c. That it is highly likely that we have yet to see the low in UK house prices in real terms, which either means a sustained period of inflation or that the UK house prices revisit there 2009 March Bear market lows.
Conclusion
This analysis suggests that the value of UK house prices will continue to be eroded in real terms as a consequences of high inflation and weak nominal house prices trends which implies several years of stagnation to be followed by several more years of weak house prices growth in real terms. Thus those looking for a return to the boom times over the next few years are likely to be disappointed, especially the buy to let brigade that rely on capital appreciation in real terms to generate investment returns after costs.
The updated graph shows how things panned out in terms of a housing market bottom and what that bottom now implies for house prices for the remainder of this decade.
The implications of the real trend in UK house prices are:
1. The forecast real terms trend trajectory of June 2010 proved remarkably accurate in terms of mapping out where UK house prices would likely bottom several years later both in terms of price and time. Thus this indicator will again play a pivotal role in the extension for my existing forecast.
2. This supports my long standing view that the UK housing bull market can be sustained for the WHOLE of the remainder of this decade (6 years) and probably beyond.
3. That my existing expectations for a 10% per annum trend trajectory is more than sustainable, in fact the average rise in UK house prices over the next 6 years could easily exceed 80%! Which translates into an average of over 13% per annum that is well beyond anything that most housing market commentators, academic economists and journalists who think they are economists can comprehend today.
Population Growth, Unemployment, Wages, Affordability....
This articles concluding trend forecast also includes implications of analysis of population growth, house building, unemployment, wages, mortgage debt and affordability that have been left out of this article but are contained within the new UK Housing Market Ebook (Free download from Mid Jan 2014) i.e. the below graph illustrates continuing out of control immigration.
02 Aug 2010 - UK Population Growth and Immigration Trend Forecast 2010 to 2030
Existing UK House Prices Forecast 2014
UK house prices as measured by the Halifax (NSA - November) are now rising at a rate of 8.5% per annum as opposed to falling at a rate of over 2% per annum when I flagged an imminent UK housing multi-year bull market over a year ago.
08 Sep 2012 - UK Home Extension Planning Rules Relaxed to Boost Economy, Trigger Housing Bull Market
I am continuing to see positive signs towards a multi-year bull market, so I am giving you another head start on an emerging probable multi-year bull market in UK housing.
The trend trajectory continues to home in on my forecast expectations for UK house prices to be rising at a rate of more than 12% per annum for January 2014 data, and then average a rate of 10% per annum.
19 Aug 2013 - UK House Prices Bull Market Soaring Momentum
In terms of the bull markets current momentum, the UK housing market is accelerating towards an annual inflation rate of at least 10% per annum. Given the markets current trend trajectory, UK house prices could be rising by 10% per annum as early as on release of the Halifax data (NSA) for October 2013 (in November), and continue accelerating to a rate of more than 12% per annum for January 2014 data (released Feb 2014).
The bottom line is that the UK bull market is only just getting underway and will likely last the remainder of this decade, yes there will be overbought states when prices run away to more than 20% per annum followed by corrections that see virtually zero or even negative growth for a month or two, but the over-riding trend will be that of a strong bull market, that in terms of momentum will average at least 10% per annum.
Formulating a House Prices Forecast
In formulating a trend forecast for UK house prices beyond my existing forecast expectations into Mid 2014 and for several years beyond of 10% per annum, I need to weigh up the influences of disparate drivers where on the positive side we have momentum, sentiment and a strong sustainable economic recovery that will last for many years whilst on the negative side we have a economy that continues to accrue a mountain of debt that seeks to delay the day of reckoning my means of the INFLATION, which is both a positive in times of inflating prices and a negative in terms of eroding purchasing power of earnings and affordability which is why many ask how can house prices rise when property is unaffordable for so many house hunters, and it is true that house prices today are nowhere near the affordability levels of the mid 1990's bottom, in fact today's house prices in terms of affordability are beyond the early 1990's peak!
Also that high inflation also carries the risk of the Bank of England panicking to prevent a wage price spiral. Though I expect wages will continue to be depressed in real terms as a consequence of continuing high immigration from eastern europe (20 times the rate the politicians propagandised that it would be), the benefits culture catastrophe that fuels deficit spending and the convergence of GDP per capita between East and West.
So this housing bull market is NOT going to be a re-run of the last bull market! We are not going to see anywhere near 30% per annum price rises. Instead it looks set to be a far more measured affair that will likely never see a bubble spike before the bull market tops that my opinion could only be replicated during a period of out of control inflation i.e. RPI well above 10% and approaching 20% per annum.
So, in term's of generating a multi-year housing market forecast this analysis continues to resolve around a relatively mild oscillation around 10% per annum. Which implies an acceleration into the run up to the next general election followed by a slowdown to a rate well below 10% per annum, that overall suggests that as long a UK inflation as measured by RPI does not persist beyond 5% per annum then UK house prices should target an average rate of 10% per annum for the remainder of this decade (6 years) and therefore target a 60% rise on the current Halifax House prices index into the end of 2019.
At present UK house prices are on an accelerating trend trajectory that implies the current momentum of 8.5% will continue to accelerate to a peak of more than 13% by Mid 2014, and likely stay above 10% into the May 2015 election, following which the momentum will likely slow sharply during 2016 which I am sure will prompt much bearish commentary at that time that slowing house prices inflation that could dip below 5% is a sign that the bull market is over when all it will do is lay the grounds for the next surge higher in momentum during 2017 and 2018, though I will leave the run up to the scheduled May 2020 General election for a future UK housing market ebook of some time during 2018. Therefore this analysis is focused on concluding in a detailed 5 year trend forecast into the end of 2018.
UK House Prices Forecast 2014 to 2018 - Conclusion
This forecast is based on the non seasonally adjusted Halifax House prices index that I have been tracking for over 25 years. The current house prices index for November 2013 is 174,671, with the starting point for the house prices forecast being my interim forecast as of July 2013 and its existing trend forecast into Mid 2014 of 187,000. Therefore this house prices forecast seeks to extend the existing forecast from Mid 2014 into the end of 2018 i.e. for 5 full years forward.
My concluding UK house prices forecast is for the Halifax NSA house prices index to target a trend to an average price of £270,600 by the end of 2018 which represents a 55% price rise on the most recent Halifax house prices data £174,671, that will make the the great bear market of 2008-2009 appear as a mere blip on the charts as the following forecast trend trajectory chart illustrates:
 Ensure you remained subscribed to my always free newsletter for housing market updates as well as FREE download access to my new UK Housing Market ebook (available from mid January 2014) which includes the full analysis and many topics beyond the forecast analysis such as -
- A step by step guide of how to buy a house.
- Analysis of buying vs renting
- How to increase the value of your home
- Managing your mortgage debt
- Maintenance that can save you a lot of money long-term
- Money saving low cost home improvements
- Regional house prices analysis
- Surveying properties - what to look for
and much more.
Mainstream Press Forecasts
Many academics and 'think' tanks that get reported upon in the mainstream press have been busy during the past few weeks up-grading their house price forecasts AFTER the recent surge higher, whilst most play it safe by just focusing on year ahead a few have looked 5 years ahead that typically still play it safe as they range in expectations for a rise in UK house prices of between 17% to 25% over the next 5 years -
CBRE - 17% Rise by 2018 - Commercial property consultants (CBRE).
OBR - 20% Rise by end of 2018 - The governments think tank (Telegraph).
Knight Frank - 24% rise by end of 2018 - A global real estate consultancy (KnightNox).
Savills - 25% rise by end of 2018 (up-rated from 18% a few months ago)- LSE listed Estate agent, whilst the most bullish but still playing it safe (Telegraph).
Main Risk to the Forecast - INFLATION
The primary risk to the forecast is inflation, whilst I don't expect low inflation to significantly impact the forecast however high inflation as manifested by a a persistent rate of more than 5% per annum will effect the forecast. Given the leveraged nature of house prices to inflation therefore this would roughly translate into the expectation that for every 1% that UK inflation stays above 5% then house prices will rise by an additional 2%. For instance if UK inflation spends several months at 7% then house prices will rise by an additional 4% per year. Though on the downside in terms of house prices, a soaring UK inflation rate will also hasten an END to the housing bull market as the Bank of England will once more panic to prevent a wage price spiral by raising interest rates to MORE than the rate of inflation which would act to seriously erode housing market sentiment towards a sub RPI-inflation annual house price inflation rate.
Formulating a UK General Election Forecast 2015
Recent opinion polls put Labour 6 points ahead of the Conservatives which would translate into Labour winning an general election with a 74 seat majority (Independant on Sunday). Similarly the bookies also have Labour (oddschecker) as hot favourites to win the most seats at the May 2015 general election, though the odds marginally favour another hung parliament, whilst the Conservatives trail a distant third in their chances for an outright election win. However, what the opinion pollsters, bookies and the mainstream media commentators fail to grasp is the likely impact of accelerating UK housing market momentum on an general election that is still 18 months away (May 2015).
(Click image to enlarge)
The following graph illustrates the impact of the UK house prices trend on general election results for the past 30 years.
The key factors are the trend and strength of housing market momentum during the 2 years in the run up to each general election as being good indicators for the probable outcome in terms of which party will win (government or opposition) and the size of the likely majority.
For example for the 1997 general election, despite a strengthening economy UK house prices were still stagnating and showing no signs of breaking out of what was a 6 year slump that they had been revisiting the bottom of the trading range for the preceding 3 years. The result was a huge majority win for Tony Blair's opposition Labour party.
The next such negative event for parties in power was in the rum up to the 2010 general election, where despite the housing market coming out of a severe bear market by the time of the general election the trend was still in its embryonic phase so whilst momentum was improving going into the election, however the momentum would only fully manifest itself some 6 months after the May 2010 General election which represented Gordon Browns last screw-up in that he could not even get the timing of the debt fuelled election bounce in house prices right despite increasing Britain's government debt (PSND) by over 40%!
UK General Election Forecast 2015
In terms of the 'fixed' May 2015 general election, the implications of 10% per annum house price inflation for another 18 months, that builds on the housing bull market of the previous 12 months and on the embryonic bull market of 2012 are that probability strongly favours an outright Conservative election victory.
The following graph attempts to fine tune the outcome of the next general election by utilising the more conservative current house prices momentum of 8.5% which has many implications for strategies that political parties may be entertaining to skew the election results in their favour.
The the key implications of the above graph are -
- The window for an outright labour election victory has already ended as of July 2013.
- As of writing an election today would result in a Coalition government with a majority of about 40 seats.
- The window of opportunity for a Coalition government ends by mid 2014 after which there is an increasing probability for a Conservative outright majority.
In conclusion a May 2015 general election at an average house price inflation rate of 8.5% would result in a Conservative overall majority of at least 30 seats. Therefore this is my minimum expectation as I expect UK house prices to start to average 10% per annum from early 2014 with my actual forecast converging towards average UK house prices breaking to a new all time high just prior to the May 2015 general election which would be a significant boost for housing market sentiment and thus the Conservative's election prospects.
Political Strategies
Labour Party
Labour has already lost the election, the only chance for governing is from within a Coalition with the Liberal Democrats, therefore their strategy will be aimed at fracturing the current coalition and thereby instigating an early general election, the earlier the better for each month that goes by decreases the size of majority that a Coalition government will be able to achieve.
Liberal Democrats
Given the lack of manifestation of an ability for the Liberal Democrats to think strategically it remains to be seen if they will be able to read the writing on the wall for the only way the Liberal democrats can survive is by fracturing the current coalition, which for them it's a case of the sooner the better. A fractured coalition triggering an early general election would mean burning the bridges with the Conservatives and thus a Labour / Lib Dem coalition is the only outcome that would deliver the Lib Dems power again. However, as is more probable, should the Liberal Democrats cling on in coalition with the Conservatives then they will likely find themselves out of power in May 2015.
Conservatives
The tories need to play things stealthily by downplaying their election prospects and attempting to keep their Lib- Dem coalition partners heavily sedated by bending over backwards to appease them for the Coalition has entered its maximum danger zone time window for breaking apart and delivering a Labour / Lib-Dem Coalition government. So expect the Conservatives to continue to overly friendly towards their coalition colleagues despite increasingly desperate attacks from frightened Liberal Democrat MP's. Therefore the Conservatives strategy is clearly to keep the Coalition government ticking along for as long as possible and they hope all the way into May 2015.
Given the various windows of opportunities, therefore at this point in time the ball is clearly in the Liberal Democrats court for the next few months are crucial because if the Coalition government survives into Mid 2014 then there will be an increasing probability for a Conservative outright victory. It is very difficult at this point in time to determine what increasingly desperate Liberal Democrats will choose to do. However given the trend to date of the Coalition having survived thus far, therefore probability favours the coalition continuing all the way into 2015 and thus the Conservatives look set to win the next general election with a small majority of perhaps 30 seats, despite all of the media spin that surrounds the likes of UKIP having destroyed the Tories chances of winning the next election.
Also subscribe to our youtube channel for the video version of this analysis (parts 1&2) and the forecast.
Your housing bull market analyst wishing you all a happy and prosperous new year.
Source and Comments: http://www.marketoracle.co.uk/Article43771.html
Nadeem Walayat
Copyright © 2005-2013 Marketoracle.co.uk (Market Oracle Ltd). All rights reserved.
Nadeem Walayat has over 25 years experience of trading derivatives, portfolio management and analysing the financial markets, including one of few who both anticipated and Beat the 1987 Crash. Nadeem's forward looking analysis focuses on UK inflation, economy, interest rates and housing market. He is the author of four ebook's in the The Inflation Mega-Trend and Stocks Stealth Bull Market series.that can be downloaded for Free.


 Nadeem is the Editor of The Market Oracle, a FREE Daily Financial Markets Analysis & Forecasting online publication that presents in-depth analysis from over 600 experienced analysts on a range of views of the probable direction of the financial markets, thus enabling our readers to arrive at an informed opinion on future market direction. http://www.marketoracle.co.uk
Disclaimer: The above is a matter of opinion provided for general information purposes only and is not intended as investment advice. Information and analysis above are derived from sources and utilising methods believed to be reliable, but we cannot accept responsibility for any trading losses you may incur as a result of this analysis. Individuals should consult with their personal financial advisors before engaging in any trading activities.
Nadeem Walayat Archive |
© 2005-2022 http://www.MarketOracle.co.uk - The Market Oracle is a FREE Daily Financial Markets Analysis & Forecasting online publication.