


The Debt Rattle - How Do We Define Value?
Politics / US Debt Dec 23, 2013 - 04:22 PM GMTBy: Raul_I_Meijer

 I would like to get your thoughts on one of the most basic questions in an economy: what is value, what creates value, and how can value change or even fluctuate? Sometimes it’s best to take a step back and make sure we properly (re-)define the terms we use, lest confusion rules the day.
As a reference for the question(s) I want to use two articles I read over the past week. In particular, I’m interested in discussing whether the Fed’s Quantitative Easing (QE) programs have created value, and whether QE is capable of doing so in the first place. And I don’t mean obvious views like ‘money has no value at all because it’s created out of nothing as credit/debt’, we know that. I want to start with the idea that an asset, a good, plus the work man is capable of, can be assigned a value in dollar terms, and then see how that value is defined.
The first article comes from Mark J. Perry, University of Michigan economics professor and scholar at The American Enterprise Institute (and I know what various parties think about the AEI, that’s for another discussion). Perry quotes from a report by the World Federation of Exchanges, and there are some impressive numbers in that. What surprised, even baffled me, was Mr. Perry’s conclusion at the end.
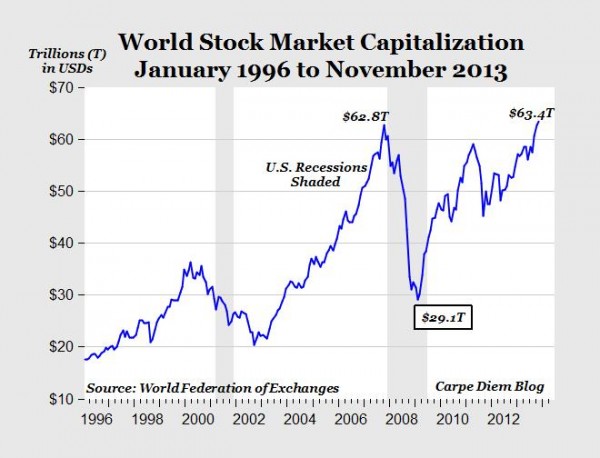
The Paris-based World Federation of Exchanges (WFE), an association of 58 publicly regulated stock market exchanges around the world, recently released updated data on its monthly measure of the total market capitalization of the world’s major equity markets through the end of November. Here are some highlights:
1. As of the end of November, the total value of equities in those 58 major stock markets reached $63.4 trillion and set several milestones. First, global equity value reached a new all-time record high in November, and second, exceeded for the first time the previous all-time record monthly high of $62.8 trillion for global equity valuation in October 2007, several months before the global economic slowdown and financial crisis started, and caused global equity values to plummet by more than 50% (and by almost $34 trillion), from $62.8 trillion at the end of 2007 to only $29.1 trillion by early 2009 (see chart).
2. Global equities gained slightly more than $700 billion in value during the month of November, and increased by 1.1% from October.
3. Compared to a year earlier, November’s world stock market capitalization increased by 20.1%, led by a 23.0% gain in the Americas, followed by increases of 21.1% in the Europe-Africa-Middle East region and 15.9% in the Asia-Pacific region.
The global stock market rally over the last five years has added back more than $34 trillion to world equity values since 2009, and demonstrates the incredible resiliency of economies and financial markets to recover and prosper, even following the worst financial crisis and global economic slowdown in at least a generation.
My immediate question is: really? That’s what that demonstrates? Incredible resiliency? It had nothing to do with QE and other stimulus measures? What about all the reports about increased poverty, food stamps, pension cuts, budget cuts, 50+% unemployment among young people in several countries, and many more stories from the bottom rung, how do they fit in with that incredible resiliency? How can stock markets set record new highs while economies still suffer? And why does the Fed taper QE by just 10$ billion out of a total $85 billion a month when the S&P 500 hits those new records?
Given that QE is ultimately the financial responsibility of everyone in the economy, why is it that not everyone seems to benefit from it? What about fundamentals? Wouldn’t it make sense to first produce and consume more before stocks set new records? Isn’t that what the S&P is supposed to reflect? Not that I think we need to consume more, mind you, if only because we would have to borrow more and get deeper into debt in order to raise consumption (there are other reasons), and we’re already record deep in debt (no shortage of records). I mean, isn’t it perhaps equally valid to say we see an incredible bubble building up as it is to talk of incredible resiliency? Exactly what part of “Incredible resiliency” is not merely wishful thinking? And how do you know? I know it’s Christmas time, but come on …
The second article is by Robert Frank at CNBC, who poses questions pretty similar to what I did yesterday in The Ben Bernanke Balance Sheet. In a few words: what is the link between stimulus and increasing inequality?
QE: The greatest subsidy to the rich ever?
Every Ferrari dealership in the country should have a framed picture of Ben Bernanke in their lobby. It should read: “Our #1 Salesman.”
The largesse of the Federal Reserve over the past five years has amounted to one of the largest ever subsidies to the American wealthy -fueling record fortunes, record numbers of new millionaires and billionaires, and an unprecedented shopping spree for everything from Ferraris to Francis Bacon paintings. The prices of the assets owned by the wealthy, and the things they buy, have gone parabolic, bearing little relationship to the weak, broader economy.
On Wednesday, the Fed decided to start the long-awaited taper, dialing down its purchases of mortgage bonds and Treasury securities by a combined $10 billion. But the core of its program will remain through to 2014. And even if the Fed ends quantitative easing altogether next year, it’s become increasingly clear that much of the gains from the program have flowed to the top 1%.
More millionaires have been created over the past five years than during the entire eight years of the Bush administration. According to Spectrem Group, there were 2.3 million new millionaires created between 2008 and 2012. This year, the number will likely grow by at least 200,000, which would bring the millionaire population past its previous record in 2007.
[..] According to Wealth-X, the top 10 billionaires in America saw their fortunes grow by a combined $101.8 billion this year. [..] Fed policy has fueled a surge in the value of financial assets. Since the wealthiest 5% of Americans own 60% of financial assets, and the top 10% own 80% of the stocks, those gains in financial assets have gone disproportionately to a small group at the top.
We have record stock market highs and record numbers of new millionaires and billionaires on the one hand. On the other, there’s the $17 trillion record in US national debt, the record $4 trillion Fed balance sheet, and the near record $11.28 trillion household debt. Put together, they somehow “demonstrate the incredible resiliency of economies and financial markets to recover and prosper”.
It has to be all of them together, right? You can’t just look at the stock market and the new rich and declare all lost terrain recovered, and all problems solved, not without accounting for two times US GDP in debt, that would be a tad careless. A $17 trillion dollar federal debt does not seem to spell “prosper”. Neither does an $85 (soon $75) billion a moth QE package, except for the direct recipients.
My initial question was about value. Mr. Perry says that “the total value of equities in those 58 major stock markets reached $63.4 trillion”. First, I’m not sure that’s the proper use of the term “value“. It certainly doesn’t look good enough to qualify as intrinsic value. Valuation, perhaps, but that’s a whimsical one.
I would like “value” to be more resilient than something that just goes from $62.8 trillion at the end of 2007 to $29.1 trillion by early 2009, and then back up to $63.4 trillion 5 years later, a move that coincides with huge rises in government debt. If anything, that seems a recipe for disaster. If we presume that a connection exists between the increase in debt on one side and the increase in “asset value” on the other, then I would say chances are we’re looking at both a gigantic wealth transfer from the poor towards the rich and a huge bubble that allows that to happen, and that will make the poor even poorer when it bursts. Which seems inevitable, because debt by itself cannot create value.
And if I’m right, what we’re seeing is not the incredible resiliency of the markets, and no real increase in asset value, but an increase in the threat to the social cohesion of our communities, cities and nations. But I could be wrong. Perhaps I’m the one who misinterprets the value of the term “value”.
By Raul Ilargi Meijer
Website: http://theautomaticearth.com (provides unique analysis of economics, finance, politics and social dynamics in the context of Complexity Theory)
Raul Ilargi Meijer Archive |
© 2005-2022 http://www.MarketOracle.co.uk - The Market Oracle is a FREE Daily Financial Markets Analysis & Forecasting online publication.