


JP Morgan House Account Reveals Gold Selling then Buying Pattern for 2013
Commodities / Gold and Silver 2013 Dec 14, 2013 - 04:16 PM GMTBy: Jesse

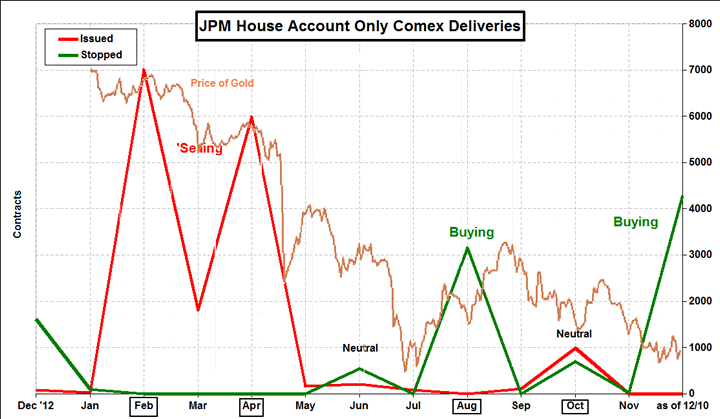
 Here is a chart that I was able to construct from CME data that shows JP Morgan's Comex Gold Delivery activity for their 'house account' only.
I have marked the nominal price of gold on the chart for this year. The last data is as of December 10, 2013.
The months marked with boxes are 'active months' for the delivery process. December is also an active month.
They seem to have had quite a good year for themselves so far.
For those who would like some color commentary, JPM came into February issuing deliveries to beat the band. They were quiet in the inactive month and then back swinging hard and delivering in size during April.
In August JPM stopped or took delivery on quite a chunk of gold bullion and the price recovered a bit from its first half of the year pounding. I can conceptualize this as 'covering' what they have issued in the first half of the year.
Since then the gold price slumped back down into November. JPM started taking deliveries (stopping) again very heavily in December. I hear they are stopping something over 90% of warrants issued.
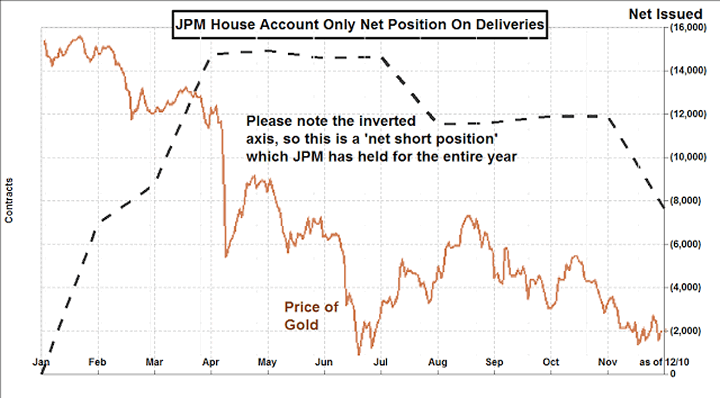
However for the year, and for the year only, their net position is still about 7,600 more contracts issued than stopped in their house account. This is down from a high of 14,600 contract net issued which they maintained from about April through July.
I have just added a second chart that shows just the rolling 'net position' for their house account with regard to deliveries for the year. Just for the sake of tracking their notional position for the year I am going to refer to this as their 'short' although they could just be selling from any inventory which they had somewhere or from the prior year. And please bear in mind that while this chart show a position that is all negative for the year, I wanted to be able to plot it against the price of gold, so I inverted the Y axis.
Whether this represents an actual short position or not depends on their opening inventory of gold bullion owned by them, and how those contracts were actually settled, be it in equivalent instruments, cash, or actual bullion.
I know this is not all the data we would like to see, and does not begin to address their offsetting positions in other transactions and markets like derivatives.
And of course I am sure that this is all 'just a hedge' being done in the CTO risk management area, just like the London whale.
Speaking of gold market antics, GATA just sent out this delightful presentation from the Banque de France entitled Managing Gold as a Central Bank.
And the band played on.
Have a pleasant weekend.
By Jesse
http://jessescrossroadscafe.blogspot.com
Welcome to Jesse's Café Américain - These are personal observations about the economy and the markets. In plewis
roviding information, we hope this allows you to make your own decisions in an informed manner, even if it is from learning by our mistakes, which are many.
© 2013 Copyright Jesse's Café Américain - All Rights Reserved
Disclaimer: The above is a matter of opinion provided for general information purposes only and is not intended as investment advice. Information and analysis above are derived from sources and utilising methods believed to be reliable, but we cannot accept responsibility for any losses you may incur as a result of this analysis. Individuals should consult with their personal financial advisors.
Jesse Archive |
© 2005-2022 http://www.MarketOracle.co.uk - The Market Oracle is a FREE Daily Financial Markets Analysis & Forecasting online publication.