


Enormous Discrepancy Between U.S. Jobs and Employment
Economics / Employment Dec 08, 2013 - 10:31 AM GMTBy: Mike_Shedlock

 Now that employment distortions related to the government shutdown in October are behind us, let's take a detailed look at the recent and growing discrepancy between jobs as reported on the establishment survey and employment as reported on the household survey.
Jobs vs. Employment Discussion
Before diving into the details, it is important to understand limits on data, and how the BLS measures jobs in the establishment survey vs. employment in the household survey.
Establishment Survey: If you work one hour that counts as a job. There is no difference between one hour and 50 hours.
Establishment Survey: If you work multiple jobs you are counted twice. The BLS does not weed out duplicate social security numbers.
Household Survey: If you work one hour or 80 you are employed.
Household Survey: If you work a total of 35 hours you are considered a full time employee. If you work 25 hours at one job and 10 hours at another, you are a fulltime employee.
Household Survey vs. Establishment Survey
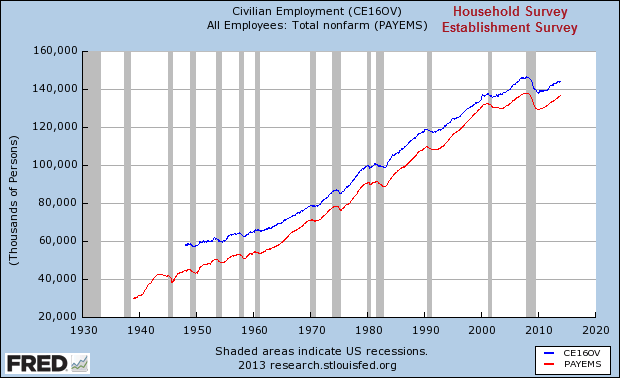
Over time, and with revisions, the two data series move in sync (as they should in normal conditions):
- People get jobs (employment should rise)
- People lose jobs (employment should drop)
However, there has been a serious discrepancy between the two data series in the last month that is not apparent in the above chart. A few tables will show what I mean.
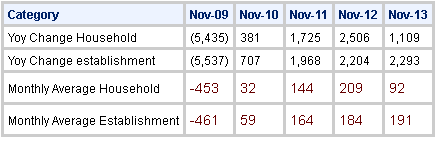
Household vs. Establishment Year-Over-Year Comparisons

Household vs. Establishment Year-Over-Year Averages
Household vs. Establishment Month-Over-Month Changes
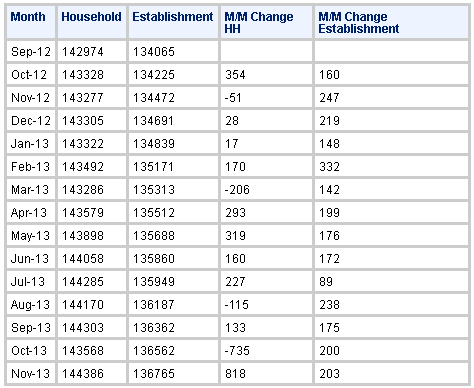
The third table shows the volatile nature of the data, especially the household survey. It's the second table that is the important one. Take special note of the bottom two lines in the second table.
Until this past year, the establishment survey and household survey moved tightly. In the last 12 months, the payroll survey averaged a gain of 191,000 jobs a month while the household survey averaged less than half of that at 92,000 jobs per month.
Blame Obamacare
Obamacare is the most likely explanation for the discrepancy.
Recall that the definition of fulltime under Obamacare is 30 hours, but fulltime to the BLS is 35 hours.
Next, consider what happens under Obamacare if someone working 34 hours is cut back to 25 hours, then picks up another parttime job.
Obamacare Effect
Prior to Obamacare 34 hours worked = 1 parttime job household survey 34 hours worked = 1 job establishment survey
Enter obamacare Person cut back to 25 hours and takes a second job for 10 hours Here is the new math
25 + 10 = 1 fulltime job on the household survey. 25 + 10 = 2 jobs on the establishment survey.
In my example, the household survey totals up all the hours and says, voilla! (35 hours = full time). So a few extra hours that people pick up working 2 part time jobs now throws someone into full time status - thus no surge in part-time employment, but there is a surge in jobs.
I commented on this discrepancy last month and repeat my claim again today.
Request to ADP
To prove my thesis, we need to weed out duplicate social security numbers. The BLS can't, but ADP can. I contacted them twice but to no avail.
I would like ADP to crunch the data and determine how many duplicate social security numbers show up vs. the same months in prior years. If I am wrong it won't be the first time. But let's have a look at the numbers and see what they say.
For further discussion and a synopsis of what really happened in today's job report, please see Beneath the Headline Numbers, Not a Good Jobs Report
By Mike "Mish" Shedlock
http://globaleconomicanalysis.blogspot.com
Click Here To Scroll Thru My Recent Post List
Mike Shedlock / Mish is a registered investment advisor representative for SitkaPacific Capital Management . Sitka Pacific is an asset management firm whose goal is strong performance and low volatility, regardless of market direction.
Visit Sitka Pacific's Account Management Page to learn more about wealth management and capital preservation strategies of Sitka Pacific.
I do weekly podcasts every Thursday on HoweStreet and a brief 7 minute segment on Saturday on CKNW AM 980 in Vancouver.
When not writing about stocks or the economy I spends a great deal of time on photography and in the garden. I have over 80 magazine and book cover credits. Some of my Wisconsin and gardening images can be seen at MichaelShedlock.com .
© 2013 Mike Shedlock, All Rights Reserved.
Disclaimer: The above is a matter of opinion provided for general information purposes only and is not intended as investment advice. Information and analysis above are derived from sources and utilising methods believed to be reliable, but we cannot accept responsibility for any losses you may incur as a result of this analysis. Individuals should consult with their personal financial advisors.
Mike Shedlock Archive |
© 2005-2022 http://www.MarketOracle.co.uk - The Market Oracle is a FREE Daily Financial Markets Analysis & Forecasting online publication.