The S&P 500: Offering Investors Attractive Valuations Or a Bull Trap?
Stock-Markets / Stock Market Valuations Apr 15, 2008 - 11:09 AM GMTBy: Donald_W_Dony

 As the S&P 500 gradually drifts lower in 2008, many analysts and portfolio managers are now saying the index has attractive valuations and are offering investors excellent profit opportunities. But is the S&P 500 really cheap at present levels? And are these recent short-term rallies just a bull trap?

But first, what is a bull trap? It is a false signal indicating that a declining trend in a stock or index has reversed and is starting to head upwards (and providing investors with a sense of false optimism) when in fact, the security is continuing to fall. A bull trap often causes some investors to buy securities at seemingly good valuations and price levels but because the main trend is still down, the stock continues to decline after the initial short-term upward 'bull movement'. Those who bought in are "trapped" in a bad investment.
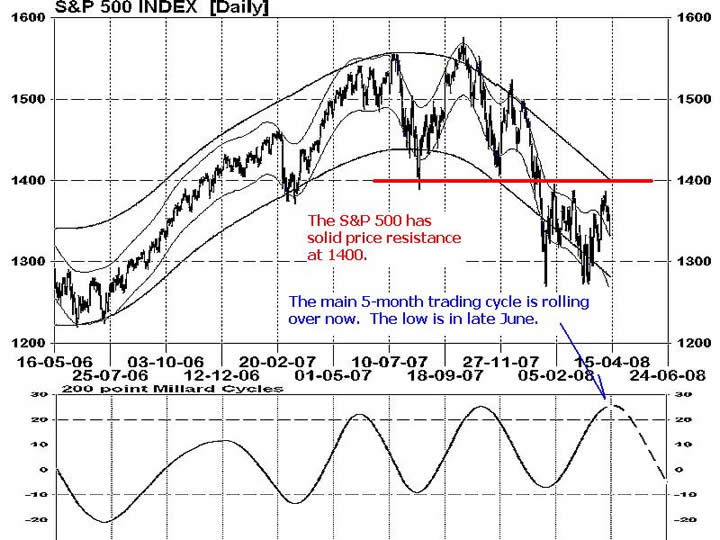
Though the S&P 500 appears attractive technically, these short-term rallies up to 1400 from February to early April can be considered a bull trap. Technical models (lower portion of Chart 1) indicates that increasing downward pressure should begin to build in May and June.

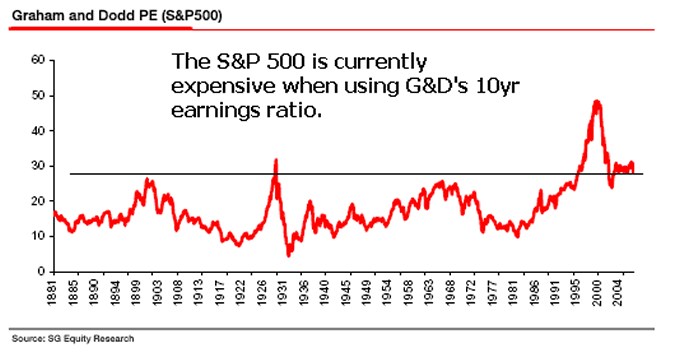
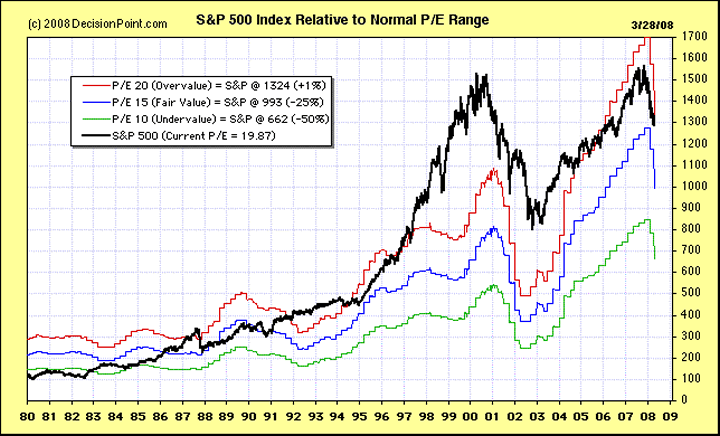
And what about fundamentally? Is the S&P 500 really offering attractive valuations now? Certainly not according to the fathers of value buying. Chart 2 shows Graham and Dodd's formula for judging long-term valuations. Only during the technology bubble in 2000 was the S&P 500 more overvalued. At current levels (Chart 3) the index has a P/E of 19.87. Fair value (P/E 15) would be at 993. This would suggest the S&P 500 needs to decline 25% to equal that amount. Undervalued (P/E 10) would be at 662, or 50% lower than the present level.

Bottom line: The S&P 500 is currently expensive when evaluated for normal P/E. A price level 300 points lower then the present 1300 would make the benchmark index only fair value. The current over valuation of the S&P 500 increases downside risk.
Investment approach: History indicates that overvalued indexes in bear markets are especially susceptible to downward pressure and lower numbers. Investors may wish to limit any purchases of S&P 500 stocks until the index has at lest drifted down to fair value. This would be at about 993. Alternatively, investors can profit from the anticipated decline by purchasing bear ETFs on the S&P 500. The Short S&P 500 proShares (SH) provides upward movement when the S&P 500 falls.
More research on the S&P 500 and other North American stock indexes can be found in the April newsletter. Go to www.technicalspeculator.com and click on member login.
Your comments are always welcomed.
By Donald W. Dony, FCSI, MFTA
www.technicalspeculator.com
COPYRIGHT © 2008 Donald W. Dony
Donald W. Dony, FCSI, MFTA has been in the investment profession for over 20 years, first as a stock broker in the mid 1980's and then as the principal of D. W. Dony and Associates Inc., a financial consulting firm to present. He is the editor and publisher of the Technical Speculator, a monthly international investment newsletter, which specializes in major world equity markets, currencies, bonds and interest rates as well as the precious metals markets.
Donald is also an instructor for the Canadian Securities Institute (CSI). He is often called upon to design technical analysis training programs and to provide teaching to industry professionals on technical analysis at many of Canada's leading brokerage firms. He is a respected specialist in the area of intermarket and cycle analysis and a frequent speaker at investment conferences.
Mr. Dony is a member of the Canadian Society of Technical Analysts (CSTA) and the International Federation of Technical Analysts (IFTA).
Donald W. Dony Archive |
© 2005-2022 http://www.MarketOracle.co.uk - The Market Oracle is a FREE Daily Financial Markets Analysis & Forecasting online publication.


