


Stock Market Chart Analysis of SPX, $VIX,UVXY
Stock-Markets / Stock Markets 2013 Dec 03, 2013 - 11:21 AM GMTBy: Submissions

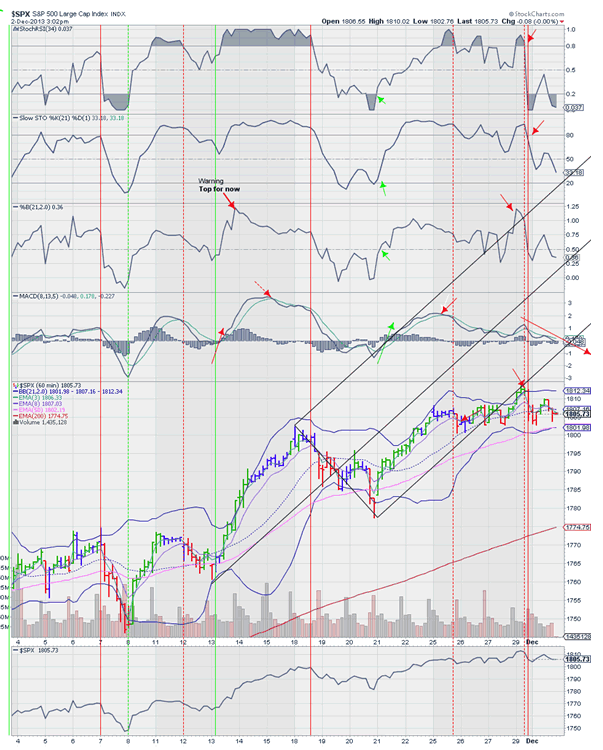
 Thomas Clayton writes: I have iterated the numerical variables of the Indicators to Synchronize with the Price. As noted the Sell is triggered with a cross below Stoch RSI 0.8, Slow Stoch 80, %B Peak, and MACD fast line impending crossing Below Zero and MACD line Crossing down in this case. The Stoch RSI will lead Slow Stoch for an early warning. Notice the MACD cross below Zero, there is usually and acceleration in Price in that respective direction. The MACD dark blue line is just passing below Zero, If follow through on Tues. Will be a surge down in the $SPX.
THE $VIX Volatility. Page 8-- Index moves inverse to the $SPX -. Like Buying “Insurance” to cover your Long Position of SPX. Here is a Buy a Stoch RSI at 0.2, Slow Stoch 20, %B at 50 and the MACD positive cross and fast line cross at Zero, notice the surge in Price when this crossed Zero on the upside. You may anticipate this, the day before. Also, the peak in %B is a forewarning of a near term peak in price an profit taking Op if you are an intradayer. See page 7 for the UVXY 15min Chart which works well for Intraday trading. Profit taking early today then re enter.-see 15min. See the exaggerated leverage of the UVXY vs the $SPX beneath.
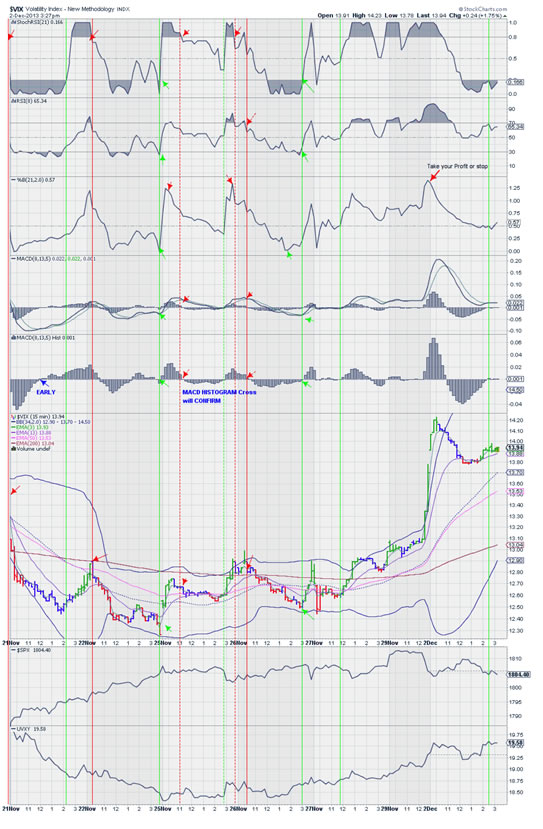
$VIX 15 minute Applying the same rules. The actual Buy Signal on Nov 27th. Cross of MACD Zero and a surge in price with a peak in the Indicators.. called for a Sell Liquidation for Profits. Aslong as MACD %B remain above Midline..indicates and Uptrend.. and wait for next positive Up in Indicators to re enter Long Position, which occurred at 2:30pm.. however, we don’t know what will happen at the next day opening. $VIX can be trade with Option Calls & Puts
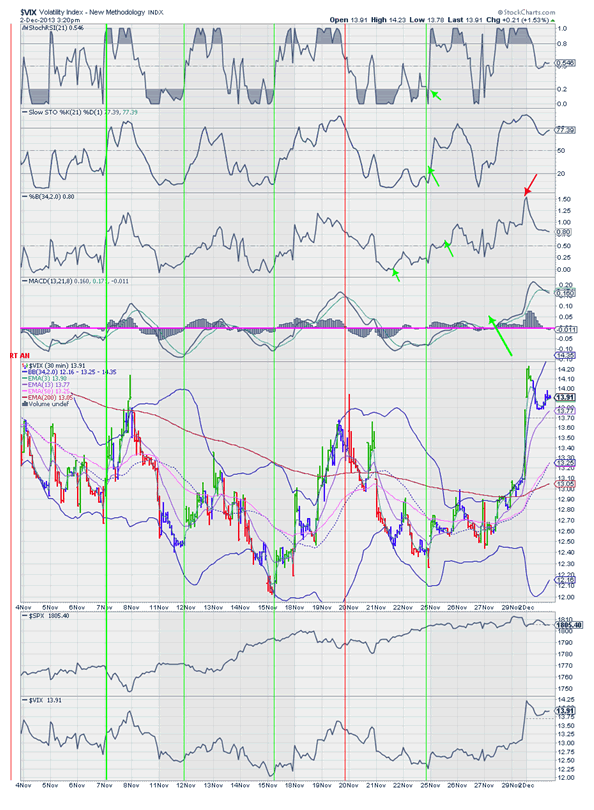
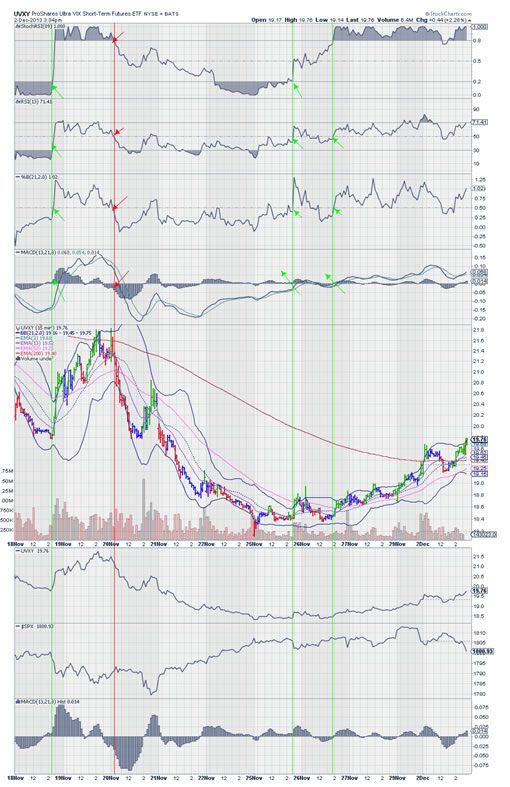
The next is UVXY 15 min, page 9. The 15min UVXY is more Sensitive and you see the Buy on Nov 26TH, with the fast ling MACD Zero cross. Use outide Bollinger Band as early Monday as a Sell Op and buy back when Elder Price Bars change from red to blue-green to re enter Long. Notice price has crossed EMA50 & EMA200. Uptrend as long as indicators are above midpoint and downtrend when below midpoint. Always trade with the Trend.
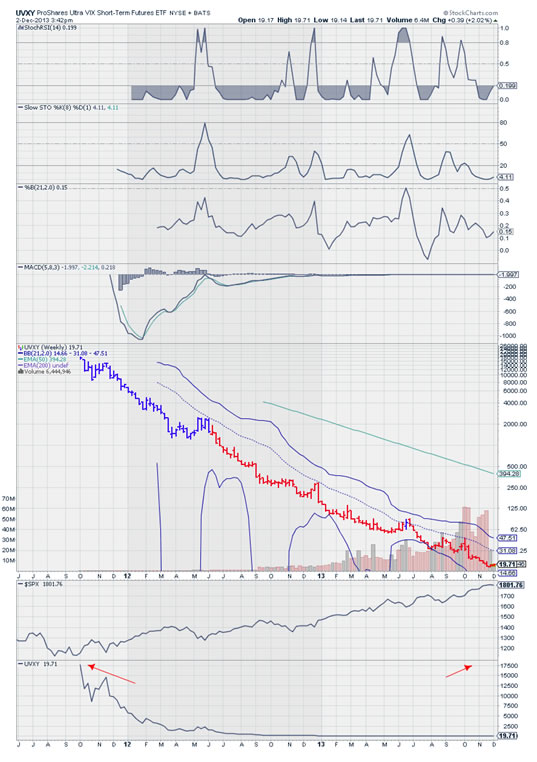
Lastly is the Long Term Chart for UVXY Pg 9. and its potential if the Market plummets. Like a Lotto Ticket. Notice how %B is stayed below 0.5 and MACD below Zero. during the prolonged decline of UVXY and rally of $SPX. If this chart starts to show Blue then Green- Jump on board during $SPX rallies.
You may review my work at stochcharts.com, Public Charts and I am Rank no. 11. Easy Money- contact stemsmexico@gmail.com.
I am a retired pharmacist, but went through the Dean Witter training Program, as depicted in the movie "Seeking Happynes" with Will Smithk, and worked as a Representative for stocks and commodities for D. Witter, which was later absorbed into Morgan Stanley.. I do this as an avocation now. It would have been nice to have had access to this Technical Analysis as offered at stockcharts.com back in the early 1970s.
By Thomas Clayton
© 2013 Copyright Thomas Clayton - All Rights Reserved
Disclaimer: The above is a matter of opinion provided for general information purposes only and is not intended as investment advice. Information and analysis above are derived from sources and utilising methods believed to be reliable, but we cannot accept responsibility for any losses you may incur as a result of this analysis. Individuals should consult with their personal financial advisors.
© 2005-2022 http://www.MarketOracle.co.uk - The Market Oracle is a FREE Daily Financial Markets Analysis & Forecasting online publication.