


Extraordinarily Dangerous Stock Markets
Stock-Markets / Stock Markets 2013 Nov 07, 2013 - 03:03 PM GMTBy: Brian_Bloom

 The Federal Reserve’s Quantitative Easing has given rise to an all time low in the money multiplier which, in turn, has a higher probability of rising than falling. Notwithstanding the recent explosion of personal debt, Chart #5 above shows an emerging propensity of the US public to want to save a higher percentage of their income and/or pay down debts. Therefore, the most likely driver of a rising ratio will be a rise in savings relative to money stock which, in turn, will place a downward pressure on corporate earnings. It follows that continuation of QE by the Fed will do nothing other than push the money multiplier ratio lower. Therefore QE is becoming impotent as a strategy for driving the US economy. By extension, if the savings rate continues along its early rising trend, this will likely be accompanied by recessionary conditions which, in turn, will place a downward pressure on Price:Earnings ratios.
***
There are two unconventional analysts who have come to my attention over the years and whose work is unique to them:
The first is Mr. Alan Newman, who publishes a report entitled “Pictures of a Stock Market Mania”. His latest report, dated November 5th 2013 can be viewed here: www.cross-currents.net/charts.htm ).
The second is Professor Didier Sornette, who’s bio can be viewed at (http://www.er.ethz.ch/people/sornette ) and whose stock-market relevant work is summarised on the following You-Tube of a TED Talk entitled “How can we predict the next financial crisis?”that he gave in June 2013. http://www.ted.com/talks/didier_sornette_how_we_can_predict_the_next_financial_crisis.html
If Professor Sornette’s model is to be believed, we can expect a significant market peak in mid November 2013 – see chart below: (source: Casey Research)
Chart # 1 – Time Singularity Forecast
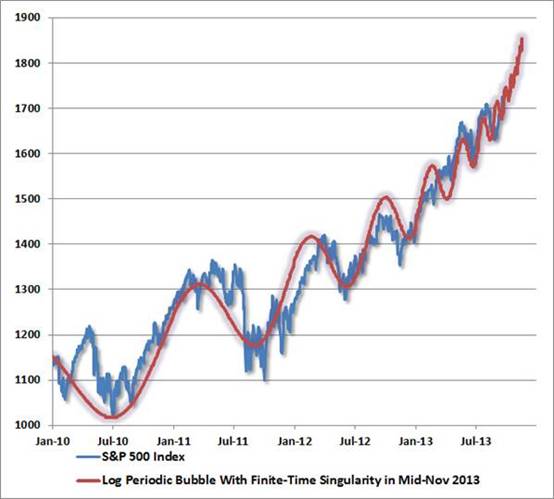
Of course, this begs the question as to whether this will be just another trading peak or whether it will be a significant peak.
My own view is that Alan Newman’s work should be seen as a backdrop to any analysis. From the time that Alan Greenspan came onto the scene, the Dollar Trading Volume (DTV) as a multiple of Gross Domestic Product has been rising. At the peak of the 1929 stock market bubble it was well over 100%. Now it is around 350%.
In 1929, the ratio of DTV to Market Capitalisation (the combined value of all companies quoted on the NYSE) was around 200%. Now it is just shy of 300%, having fallen from a peak of 400% in 2009.
Of course, this has occurred as a direct consequence of what has come to be known as “algorithm” trading and as an indirect consequence of the US Federal Reserve’s loose money and low interest rate policies.
A couple of days ago a friend sent me a Point & Figure chart of the gold price – which showed a “buy” signal. Within a day or so of his having sent it, the chart looked like this (source stockcharts.com)
Chart #2 – Point & Figure Chart of the Gold Price (Nov 6th 2013)
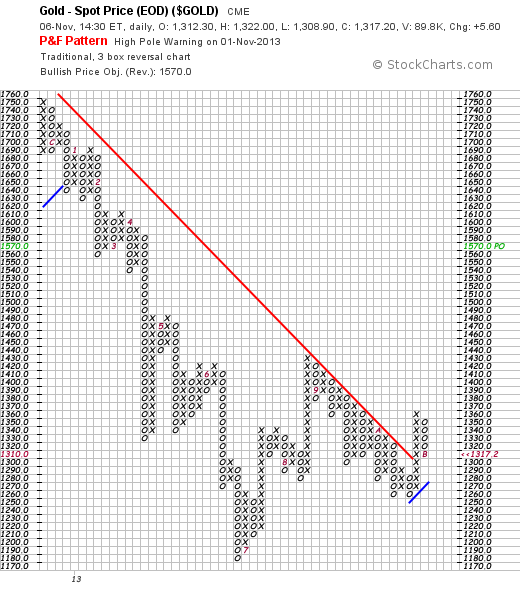
Note how the buy signal reversed itself with a high pole warming sell signal and that reversal coincided with a rise to a new high by the Dow Jones Industrial Index (not shown).
Of relevance, on November 6th 2013, the percentage of financial advisers who were bullish on equities was 82.4%, having pulled back from a high of 89.2% on May 29th. “Blue skies, nothing but blue skies”, do they see
Of course, this begs the question of when the stock market mania will end? Will it end around mid November, as per Sornette’s model? The short answer is: There is a high probability.
The chart below (courtesy Bigcharts.com) is worrying from two perspectives:
Chart # 3 – Monthly Chart of the Dow Jones Industrial Index.
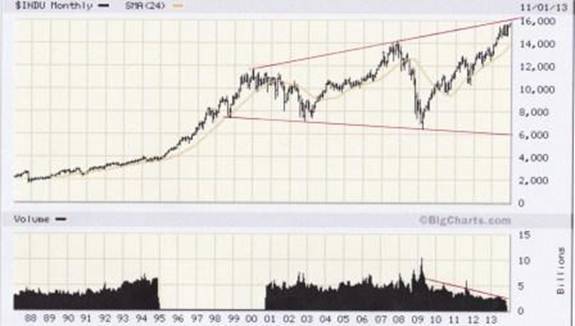
First, the reader will note the two diverging red trend lines. This flows from the market rising to higher highs in its bull phases and falling to lower lows in it bear phases and is indicative of investor confusion. Secondly, the reader will note that since 2009, the index price has been rising on falling volume, which is typically not a healthy sign.
In terms of Alan Newman’s mind map, it seems that the algorithm traders have been “ramping” the market even as genuine investors have been withdrawing. If this interpretation is correct, then we are watching a potentially dangerous end-game unfolding.
By applying pure logic, if volume has been contracting, then it seems unlikely that the Dow Jones Index will be able to overcome the resistance offered by the upper trend line. For that to occur we will need to see buying pressure –which, as a matter of fact, has been waning. Therefore we appear to be very close to a market peak – which is confirmed by Sornette’s model.
Further, if history is to repeat itself, the market might pull back as far as the lower (descending) trend line.
A couple of weeks ago, the chart below found its way into my in-box. It was published in the Hoisington Quarterly Review and Outlook, Third Quarter 2013 (see: http://www.hoisingtonmgt.com/pdf/HIM2013Q3NP.pdf )
Chart # 4 - US Money Multiplier
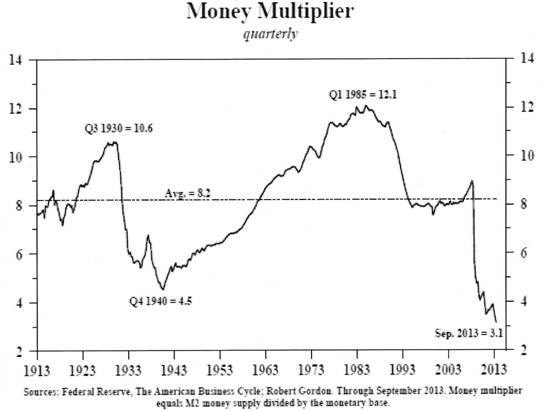
This money multiplier is derived by dividing the M2 Money Supply by the monetary base (cash sloshing around).
Now, let’s think about what the above chart means. The September ratio of 3.1 was significantly lower than the ratio of 10.6 that peaked in Q3 of 1930. Arguably, that high 1930 ratio was why the Fed started pumping money into the economy in the late 1990s. Both Sir Alan and Dr Bernanke believed that the cause of the Depression was the absence of liquidity in the economy.
Well, now we have so much liquidity that the ratio is at all time low. So this begs the question: If the ratio were to rise from here, would it be because of a contraction of the monetary base or because of an increase in M2?
M2 is defined as: “the amount of money in circulation in notes and coin plus non-interest-bearing bank deposits, building-society deposits, and National Savings accounts”
It follows that, for M2 to start rising, bank and building society deposits and savings accounts will need to start growing – i.e. Savings will need to rise.
Of course, if money is taken out of the stock and bond markets and placed on deposit with savings institutions, then M2 will rise. But the flip side of this is that, if the US consumer spending accounts for around 66% - 70% of the total US economy, the extent to which savings rise will reflect a mindset of caution.
Chart #5 - US Personal Savings Rate
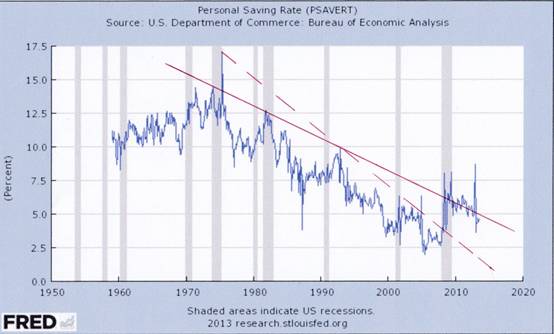
The chart above (source: http://research.stlouisfed.org/fred2/series/PSAVERT/ )
shows how personal savings rates in the US were trending down from the mid 1970s (see dashed trend line). In 2009 – simultaneously with the emergence of the recession – savings shot up from 2.5% to 7.5% and the dashed trend line was penetrated on the upside. Further, what the chart shows is that the less steep (solid) down trend line pointing to a waning propensity of the US public to want to “buy now and pay later”. More realistically, attitudes in the US are shifting to show a rising propensity to want to pay down debt, notwithstanding the recent explosion of personal borrowings (see below).
Clearly, if that happens then corporate profits will come under pressure and, consistent with history, if savings rates rise, this will be accompanied by a recession.
Unfortunately, what “drives” share prices in the long run (looking past the algorithm trading on a minute by minute basis) is two factors:
- Underlying corporate profits and
- Perceptions of future growth, which translates to rising or falling Price:Earnings ratios.
As at November 1st 2013, the P/E ratio of the S&P 500 was 18.71 and of the Russel 2000 was 87.4 and of the Nasdaq was 21.47 (source: http://online.wsj.com/mdc/public/page/2_3021-peyield.html )
This compares with historical “average” levels of around 15.5X. and historical “lows” of around 5 - 7.5X. (source: http://www.multpl.com/ )
Finally, in a recent article that spoke of strongly rising consumer debt, the following statement was made:
“At $3.04 trillion, the total is up 22 percent over the past three years. Student loans are up a whopping 61 percent.” http://www.cnbc.com/id/101103819
And the following is another quote from the same article:
“While the specter of another debt crisis might seem scary, some economists tout it as a healthy sign of a recovery. "In a moment of crisis, that's going to come back to haunt you," said Peter Cardillo, chief market economist at Rockwell Global Capital. "As long as you can support that debt through growth, it's really not a major concern."
BB Observation:
As Peter Cardillo suggested above, the only ameliorating factor will be “growth”. But the employment statistics do not yet suggest that growth is emerging. In an article dated September 5th 2013, entitled “Not Looking for Work: Why Labor Force Participation Has Fallen During the Recession” the following chart appeared: Source: http://www.heritage.org/research/reports/2013/09/not-looking-for-work-why-labor-force-participation-has-fallen-during-the-recession
Chart #6 - Slowest US Jobs Recover in 50 years
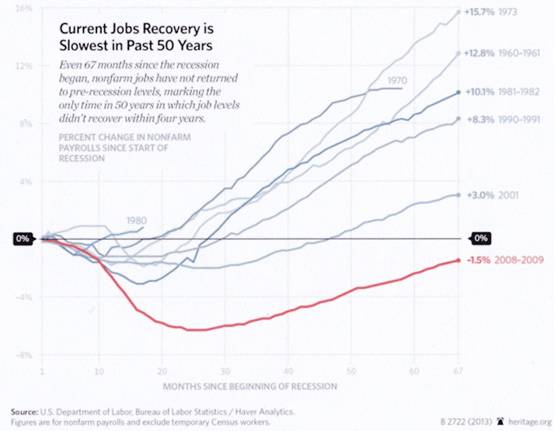
Those who are talking optimistically about future economic growth seem to be ignoring the salient fact that, to date, employment has not yet returned to levels that existed prior to the last recession.
Quote from this article:
“The American economy is experiencing the slowest recovery in 70 years. In addition to persistently high unemployment, labor force participation has fallen sharply since the recession began in December 2007. Today, 5.7 million fewer Americans are working or looking for work. This drop accounts for virtually the entire reduction of the unemployment rate since 2009—those not looking for work do not count as unemployed.
Overall Conclusion
With the money multiplier at an all time low, Sornette’s model seems believable and it should be viewed in context of Newman’s research that demonstrates an ongoing Stock Market Mania which began to emerge in the late 1990s. Given the broadening formation on the long term chart of Dow Jones Industrial Index it seems even more likely that the equity market is reaching for a peak. Looking past the explosion in private borrowing in the past three years, this conclusion is also supported by the nascent rising trend in consumer savings as a percentage of income. If this trend continues, corporate profits that will come under pressure as a consequence and, in context of unusually high P/E ratios, the US Equity Market is looking extraordinarily dangerous.
Author, Beyond Neanderthal and The Last Finesse
Beyond Neanderthal and The Last Finesse are now available to purchase in e-book format, at under US$10 a copy, via almost 60 web based book retailers across the globe. In addition to Kindle, the entertaining, easy-to-read fact based adventure novels may also be downloaded on Kindle for PC, iPhone, iPod Touch, Blackberry, Nook, iPad and Adobe Digital Editions. Together, these two books offer a holistic right brain/left brain view of the current human condition, and of possibilities for a more positive future for humanity.
Copyright © 2013 Brian Bloom - All Rights Reserved
Disclaimer: The above is a matter of opinion provided for general information purposes only and is not intended as investment advice. Information and analysis above are derived from sources and utilising methods believed to be reliable, but we cannot accept responsibility for any losses you may incur as a result of this analysis. Individuals should consult with their personal financial advisors.
Brian Bloom Archive |
© 2005-2022 http://www.MarketOracle.co.uk - The Market Oracle is a FREE Daily Financial Markets Analysis & Forecasting online publication.