


Gold Bear Market to End with a Bang!
Commodities / Gold and Silver 2013 Nov 07, 2013 - 06:14 AM GMTBy: Jordan_Roy_Byrne

 For months we’ve been writing about the major bottom to come in precious metals. It appeared we finally saw it in late June as the metals and the stocks surged during the summer. Yet, these markets trailed off in August and it continued into October. The equities were down seven straight weeks. That gave way to an oversold bounce. Unless precious metals can close above their October highs on a weekly basis, the outlook remains bearish. While this bear market is finally coming to an end, don’t expect it to end quietly. At present Gold looks eerily similar to both Gold in 1976 and the SYP in 2009 prior to their major bottoms.
The first chart below shows Gold in 1975 to 1976. Gold’s sudden decline that began in August 1975 took it from over $160/oz down to $128/oz. It was a 20% drop in one month. After it rebounded it formed a marginal new low (A) and traded around $130 for about five months. Once Gold failed at the declining 50-day moving average and lateral resistance it plummeted to its final low.
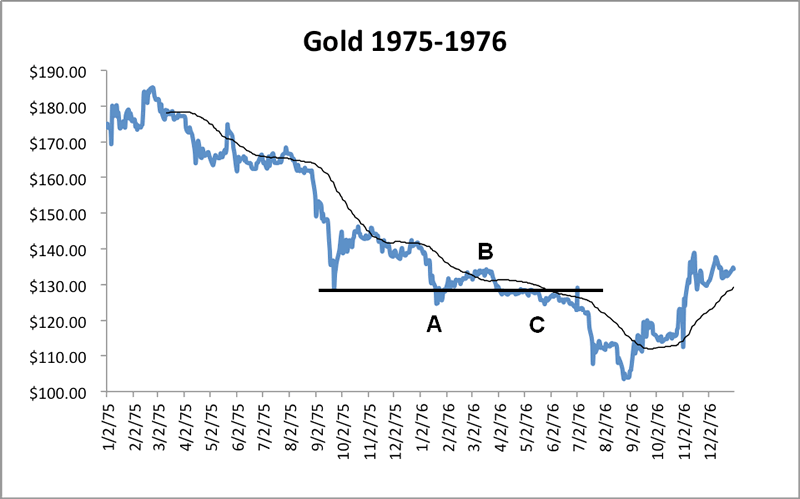
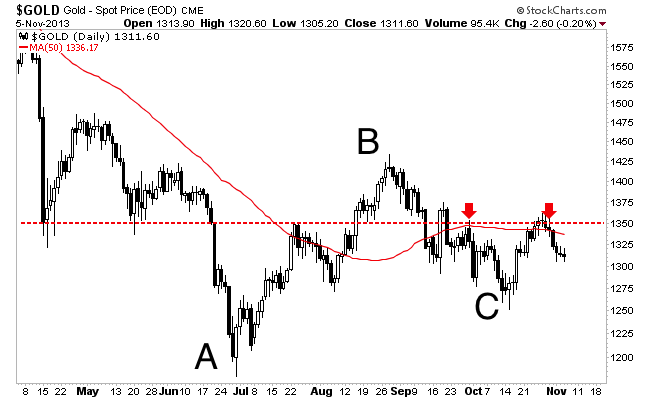
Gold in 2013 has formed a very similar pattern. The first panic low occurred in April which was followed by another low several months later. Gold then recovered back above the first panic low to point B. Point C labels the decline below the first panic low and a temporary bottom. Just like in summer 1976, Gold rallied up to a strong confluence of resistance (lateral and 50-day moving average) and failed.
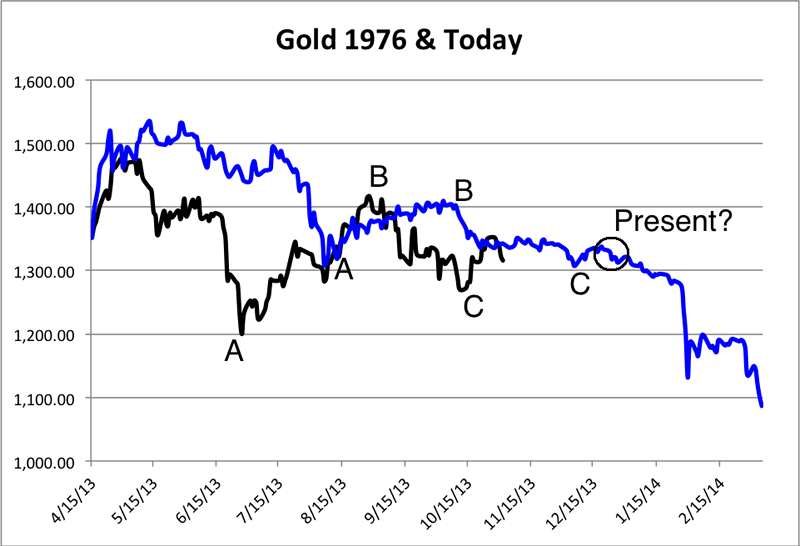
I’ve aligned both of the above plots on the same scale starting with their first panic low. The blue is Gold in 1975-1976 and the black is today. The 1976 template has Gold bottoming in early March. However, we can clearly see that Gold today is a few months ahead of that.
Next, take a look at the S&P bottom from 2008-2009. It followed the exact same pattern!
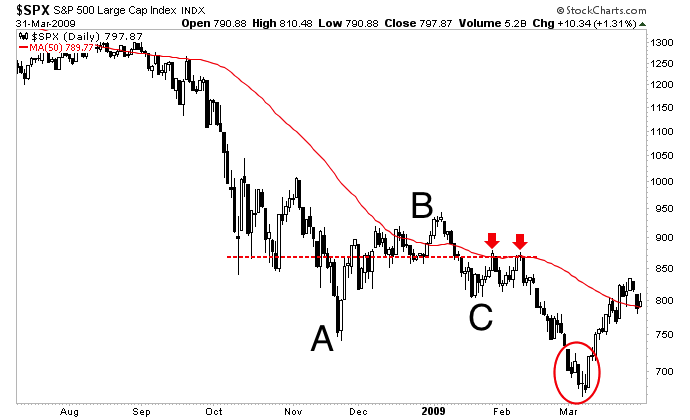
Let’s compare the three situations. In Gold from 1975-1976 its bearish consolidation (from first panic low to failure at resistance) lasted nine months and its final decline lasted two months. In the S&P 500 from 2008-2009 its bearish consolidation lasted only four months and its final decline lasted no more than four weeks. Gold’s bearish consolidation lasted about six and a half months. Judging from this data we could project Gold’s bottom to come in about six weeks.
There are a few more important things to note. Gold from 1975-1976 had a very weak rally from point A to B. It was in a weaker position and then consolidated for the longest. That is why it had the steepest final decline. The S&P in 2009 consolidated for only four months. When it broke to a new low, it made its final low the next week. Like the S&P 500, Gold today had a stronger rally from point A to B. Also, unlike the other two Gold today has been in a bear market for over two years. Considering these things, I’d expect Gold’s final bottom to be more similar to the S&P in 2009 than Gold in 1976.
How would this final decline in Gold affect the gold stocks?
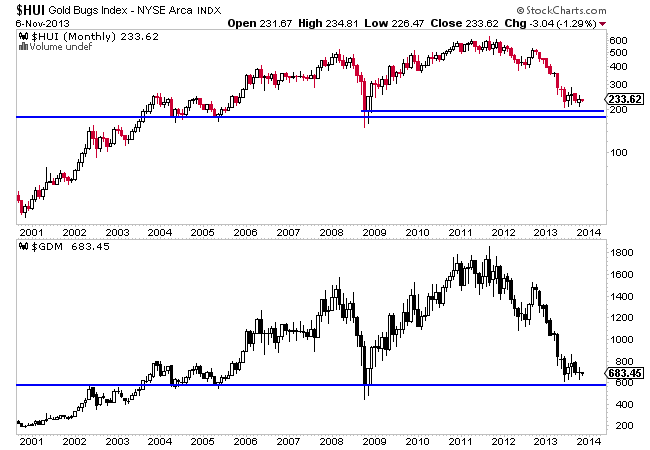
The chart below is a monthly chart of the HUI gold bugs index and the NYSE gold miners index (GDM) which is the parent of the GDX ETF. Both markets bottomed in late June not to far above the major support which dates back to 2004. In fact, we referenced this chart when we penned an editorial, one day before the June bottom. Maybe Gold will break to a new low but the gold stocks won’t. If the gold stocks do make a new low, this chart is telling you that it won’t last for long. There is very strong support sitting right below the summer lows.
Unless Gold is able to close above $1350 in the near-term on a weekly basis then consider the short-term trend bearish. Gold looks set to plunge to its final bottom. Gold bugs will cry manipulation, CNBC and Twitter types will be mocking the Peter Schiffs of the world and many will be calling for $900 Gold. I urge you to avoid all this nonsense and focus on one thing. Get yourself in position to take advantage of this bottom. It’s the very smart money that is looking forward to buying this bottom. I suspect the coming bottom will be the one the typical huge rebounds originate from.
If you'd be interested in professional guidance in this endeavor, then we invite you to learn more about our service.
Good Luck!
Bio: Jordan Roy-Byrne, CMT is a Chartered Market Technician, a member of the Market Technicians Association and from 2010-2013 an official contributor to the CME Group, the largest futures exchange in the world. He is the publisher and editor of TheDailyGold Premium, a publication which emphaszies market timing and stock selection for the sophisticated investor. Jordan's work has been featured in CNBC, Barrons, Financial Times Alphaville, and his editorials are regularly published in 321gold, Gold-Eagle, FinancialSense, GoldSeek, Kitco and Yahoo Finance. He is quoted regularly in Barrons. Jordan was a speaker at PDAC 2012, the largest mining conference in the world.
Jordan Roy-Byrne Archive |
© 2005-2022 http://www.MarketOracle.co.uk - The Market Oracle is a FREE Daily Financial Markets Analysis & Forecasting online publication.